

2017 Q2 Dealer profitability
Balram Dabhade | 31 July 2017
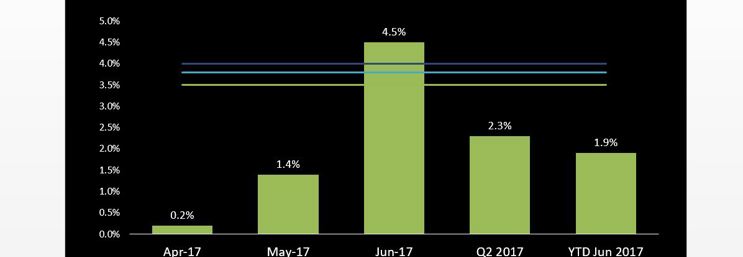
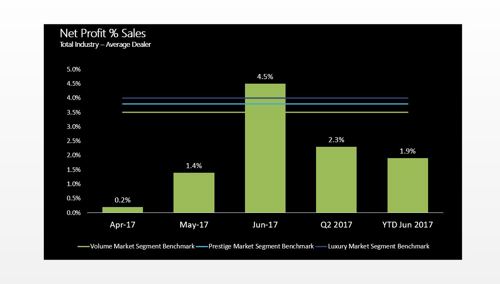
Total Industry
The dealer profitability as measured by net profit as a percentage of sales (NP%S) for the second quarter of 2017 was recorded at 2.3% and for the first half of 2017 was at 1.9%. This is the first time since 1997, the Motor Industry profitability has shown opposite movement to the consumer confidence in Australia.
While the NP%S has increased for the first half of 2017 as compared to the second half of 2016, it is still lower than the first half of 2016. The industry saw its sales revenue increase by 10%, overall dealership gross increased by 7%, but the selling gross decreased by 5% and the overheads increased by 10%. Thus the profitability eroded by 0.2% as compared to first half of 2016.
State-by-State
New South Wales/Australian Capital Territory
The average NSW/ACT dealer NP%S was 2.2% for the period Apr - Jun 2017 which is 0.3% down from the same period in 2016. Sales revenue for the state group of NSW/ACT has risen by 6% in period Apr – May 2017, while fixed expenses increased by 10% and the selling gross decreased by 0.9%. This has caused the profitability to come under pressure for this state group.
Queensland
The state of Queensland has highest dealer NP%S for the second quarter of 2017. The NP%S for Queensland was 3.2% for the second quarter of 2017. While the total dealership selling gross actually reduced for this state by 1% and the fixed overheads increased by 10%, the increase of 68% in other income and incentives saw this state profitability remain buoyant for the second quarter of 2017.
South Australia/Northern Territory
The state group of SA/NT had the second highest profitability of 2.8% for the period Apr - Jun 2017. This state group saw a stagnant sales revenue and gross, but saw a decline in the fixed expenses and an increase in the other income. This helped the profitability in this state group.
Victoria/Tasmania
This state group saw the greatest increase in the sales revenue for Q2 2017, the total dealership sales revenue increased by 23%, the gross increased by 23%, but this state group also saw the steepest increase in fixed costs which increased by 23% thus putting pressure on profitability. As a result the NP%S for this state group was recorded at 1.5% for Q2 2017, lower by 0.3% as compared to 1.8% in Q2 2016
Western Australia
The state of Western Australia had a NP%S of 2.1% which was slightly lower by 0.2% as compared to second quarter of 2016. This state had stagnant sales revenue, the selling gross reduced by 9% but the fixed costs also came down by 7% thus keeping the profitability stable.
Segments
The luxury segment had the lowest NP%S of 1.9% amongst all the segments tracked. This can be attributed to the new vehicle department, where the new vehicle gross per unit has reduced from $4,126 in first half of 2016 to $3,937 in the first half of 2017. This reduction of new vehicle gross is further attributed to erosion of pure gross (Metal gross) which has come down from $993 to $610 for the same period. The luxury segment also shown the highest fixed expense increase of 15%.
The prestige segment had a profitability of 2.5%, while the prestige segment also saw a dip in the new vehicle department selling gross, it was not as steep as the luxury segment. This along with the increased amount of other income and incentives helped the NP%S rise by 0.1% as compared to Q2 2016.
The volume segment had the highest profitability of 2.7% for Q2 2017. The new vehicle gross stayed stable and the selling gross improved by $86 per unit sold, and this segment has the highest growth in the number of units sold. This increase in number of units sold and increased profitability on new vehicles helped the volume segment have the highest profitability in Q2 2017.
*Please click on the following images for details

General Information Only
This presentation contains general information only, and none of Deloitte Touche Tohmatsu Limited, its member firms, or their related entities (collectively the “Deloitte Network”) is, by means of this presentation , rendering professional advice or services.
Before making any decision or taking any action that may affect your finances or your business, you should consult a qualified professional adviser. No entity in the Deloitte Network shall be responsible for any loss whatsoever sustained by any person who relies on this presentation.
About Deloitte
Deloitte refers to one or more of Deloitte Touche Tohmatsu Limited (“DTTL”), its global network of member firms, and their related entities (collectively, the “Deloitte organization”). DTTL (also referred to as “Deloitte Global”) and each of its member firms and related entities are legally separate and independent entities, which cannot obligate or bind each other in respect of third parties. DTTL and each DTTL member firm and related entity is liable only for its own acts and omissions, and not those of each other. DTTL does not provide services to clients. Please see www.deloitte.com/about to learn more.
Deloitte Asia Pacific Limited is a company limited by guarantee and a member firm of DTTL. Members of Deloitte Asia Pacific Limited and their related entities, each of which are separate and independent legal entities, provide services from more than 100 cities across the region, including Auckland, Bangkok, Beijing, Hanoi, Hong Kong, Jakarta, Kuala Lumpur, Manila, Melbourne, Osaka, Seoul, Shanghai, Singapore, Sydney, Taipei and Tokyo.
This communication contains general information only, and none of Deloitte Touche Tohmatsu Limited (“DTTL”), its global network of member firms or their related entities (collectively, the “Deloitte organization”) is, by means of this communication, rendering professional advice or services. Before making any decision or taking any action that may affect your finances or your business, you should consult a qualified professional adviser.
No representations, warranties or undertakings (express or implied) are given as to the accuracy or completeness of the information in this communication, and none of DTTL, its member firms, related entities, employees or agents shall be liable or responsible for any loss or damage whatsoever arising directly or indirectly in connection with any person relying on this communication. DTTL and each of its member firms, and their related entities, are legally separate and independent entities.