Dealer Profitability

What are the facts on dealer profitability? Drawing on the eProfitFocus database - with over 850 contributing dealers across Australia and New Zealand - we give you the hard numbers every month that reveal the dealer profitability story.

Just click on the reports below. 

11 - 20 of 47
  • 2017 Q2 Dealer profitability

    Balram Dabhade | 31 July 2017

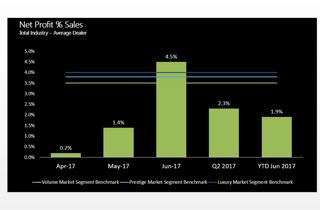
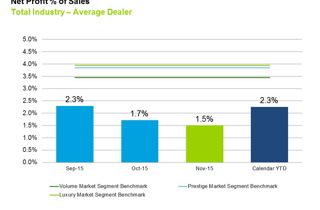
    The dealer profitability as measured by net profit as a percentage of sales (NP%S) for the second quarter of 2017 was recorded at 2.3% and for the first half of 2017 was at 1.9%. This is the first time since 1997, the Motor Industry profitability has shown opposite movement to the consumer confidence in Australia. The industry saw its sales revenue increase by 10%, overall dealership gross increased by 7%, but the selling gross decreased by 5% and the overheads increased by 10%. Thus the profitability eroded by 0.2% as compared to first half of 2016.

  • 2017 Q1 Dealer Profitability

    Balram Dabhade | 31 May 2017

    The dealer profitability as measured by net profit as a percentage of sales (NP%S) for the first quarter of 2017 was recorded at 1.6%, which is 0.4% lower than the first quarter of 2016. While the overall dealership revenue grew by 10% YoY the department selling gross has eroded by 12% putting pressure on the profitability. The gross contribution from selling new and used cars has contracted by 3% as compared to Q1 2016.

  • Q4 2016 Dealer Profitability

    Balram Dabhade | 1 February 2017

    The dealer profitability as measured by net profit as a percentage of sales (NP%S) for the last quarter of 2016 was recorded at 1.5% taking the yearly profitability for 2016 to 1.7% which was 0.5% down from 2015

  • January to September 2016 Dealer Profitability

    1 October 2016

    2016 has been an eventful year, the dealer profitability as measured by net profit as a percentage of sales (NP%S) has moved between a low point of 0.8% to a high of 4.1%. The YTD dealer profitability at the end of Qtr. 3 (end of september) was recorded at 1.9% which is 0.5 percent down from the same time last year. The quarter between July to Sept 2016 has recorded the lowest profitability in the last five years.

  • December 2015 Dealer Profitability

    1 January 2016

    Dealer profitability as measured by net profit as a percentage of sales (NP%S) was 2.5% for the average Australian dealer in December 2015. The YTD NP%S for the average dealer has gone up by 0.4% in 2015 and now measures 2.3%.

  • November 2015 Dealer Profitability

    1 December 2015

    Dealer profitability as measured by net profit as a percentage of sales (NP%S) was 1.5% for the average Australian dealer in November 2015. This was 0.2 percentage points down on the result of last month, but 0.2 percentage points up from November of last year.

  • October 2015 Dealer Profitability

    1 November 2015

    Dealer profitability as measured by net profit as a percentage of sales (NP%S) was 1.7% for the average Australian dealer in October 2015.

  • September 2015 Dealer Profitability

    1 October 2015

    Dealer profitability as measured by net profit as a percentage of sales (NP%S) was 2.3% for the average Australian dealer in September 2015.

  • August 2015 Dealer Profitability

    1 September 2015

    In August, the average dealer’s profitability dropped away slightly, driven by an increase in expenses per new vehicle sold, to reach 1.6% for August. This was measured at 0.6 percentage points below the YTD NP%S for August of 2.2%.

  • July 2015 Dealer Profitability

    Deloitte Motor Industry Services | 27 August 2015

    Dealer profitability as measured by net profit as a percentage of sales (NP%S) was 1.8% for the average Australian dealer in July 2015 and 2.5% for the calendar year-to-date (YTD).