

January to September 2016 Dealer Profitability
1 October 2016
Total Industry
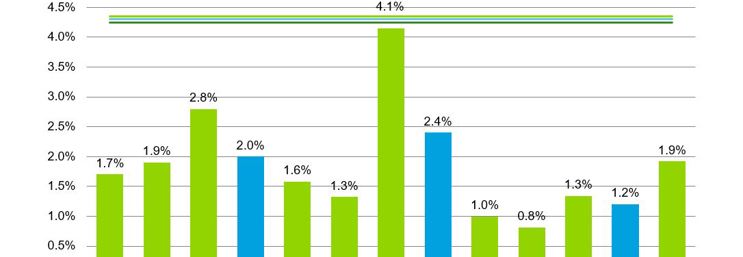
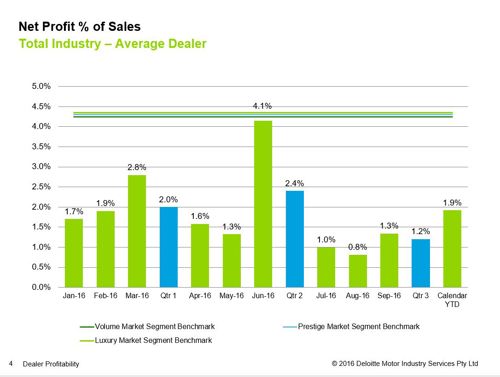
2016 has been an eventful year, the dealer profitability as measured by net profit as a percentage of sales (NP%S) has moved between a low point of 0.8% to a high of 4.1%. The YTD dealer profitability at the end of Qtr. 3 (end of september) was recorded at 1.9% which is 0.5 percent down from the same time last year. The quarter between July to Sept 2016 has recorded the lowest profitability in the last five years.
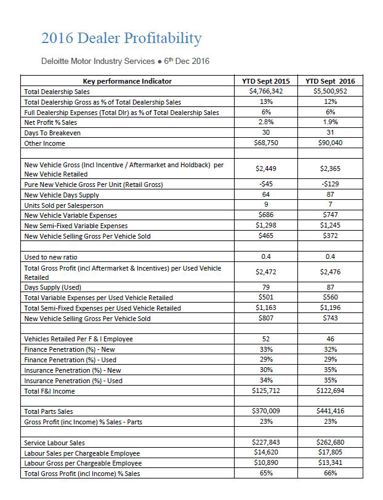
While the overall dealership revenue grew by 15% YoY the department selling gross had grown only by 1.6% putting pressure on the profitability as to support the increase in revenue the fixed expenses have gone up by 17%.
The department selling gross for new vehicles contracted by 20% YoY and for used vehicles contracted by 8%, the F&I income for an average dealer went down by 2.4%.
2016 also saw the new vehicle variable expenses go up by 9% and new vehicle semi-fixed expenses went down by 4% whereas the same in the used vehicle department went up by 12% and 3% respectively.
The parts and service income went up by 19% and 14% respectively.
The other income went up by 31% showing an increasing reliance on incentives.
State-by-State
New South Wales/Australian Capital Territory
The average NSW/ACT dealer NP%S was 2.2% for the period Jan – Sept 2016 which is 0.4% down from the same period in 2015.
The state group of NSW/ACT showed the highest dealer profitability in June with 4.4% NP%S which has tapered off to hit 1.2% in Sept 2016.
In 2016 the total dealership revenue in NSW/ACT has increased by 19%, the new vehicle revenue increased by 15% and the used vehicle revenue increased by 32%.
While the total dealership gross increased by 14% the department selling gross only increased by 6%, the new vehicle dept. selling gross eroded by 7% and the F&I income went back by 1%.
This state group showed the highest increase in the other income levels with an average dealer earning close to $113,000 in other income on a per month basis which is a 46% increase YoY.
The NP%S though went down by 0.4% YoY as the overheads have moved by 17% YoY.
Queensland
The state of Queensland has high sensitivity to the end of quarter business, with the months of March 2016, June 2016 and Sept 2016 having a higher NP%S than the predecessor months in the quarters.
The overall NP%S for the period Jan – Sept 2016 was 2.0%, with a high of 4.1% in June and a low of 0.4% in August.
The total revenue for an average dealer increased by 16% in 2016, the total dealership gross increased by 8%, although, the new vehicle gross decreased by 3%. The overall department selling gross eroded by 2.3% which was largely contributed to the new vehicle selling gross being eroded by 40%. The state of Queensland also saw the largest drop amongst states for the F&I income. The F&I income decreased by 6.5% YoY.
With an increase in dealership fixed expenses up to 16% the NP%S YoY has gone from 3.2% in 2015 to 2.0% in 2016.
South Australia/Northern Territory
The state group of SA/NT had a profitability of 2.5% for the period Jan – Sept 2016.
This state group saw an increase in dealer revenue by 24% but the total dealership gross only grew by 7% and the department selling gross decreased by 11% YoY. The departments that lost most of the selling gross were the new and the used vehicle departments. The F&I income also contracted by 9%.
The NP%S for July 2016 was the lowest this calendar year with 1.1%.
Victoria/Tasmania
The state group of Vic/Tas had an average dealer profitability of 1.1% for the period Jan – Sept 2016, this has reduced by 0.9% for the same period last year.
Although the state group showed a 3.6% profitability in June 2016, the profitability remained below 1.4% across the rest of the year.
In 2016 the state group saw an increase of 15% in total dealership revenue, and an increase of 10% in total dealership gross, while the department selling gross only increased by 2.5% the F&I income reduced by 7.4%.
Dealership fixed expenses were up by 18% and other income by 21%, this resulted in a NP%S erosion of 0.9%.
Western Australia
Western Australia saw a 0.3% increase in NP%S YoY between Jan – Sept 2015 – Jan – Sept 2016. The NP%S for the period Jan – Sept 2016 was at 1.8%.
Although the total dealership revenue for an average dealer eroded by 2% with the new vehicle revenue reducing by 14%, the used vehicle revenue saw a strong growth of 20%.
The total dealership gross eroded by 2%, new vehicle gross went down by 7% but the used vehicle gross went up by 5%.
The department selling gross went up by 11%, new vehicle selling gross went up by 25%, the used vehicle gross although positive reduced by 14% and the F&I income went up by 26%.
This state saw the lowest increase in the fixed expenses with costs increasing only by 10% and other income going up by 17%. This contributed a 300 basis points increase in the NP%S YoY.
Segments
The luxury segment and the prestige segment had a NP%S of 2.0% for an average dealer for the period Jan – Sept 2016, which is down 0.6% for luxury and 0.4% for prestige YoY.
The volume segment had a NP%S of 1.8% which is 0.6% down from the 2.4% NP%S for the same period in 2015.
**Please Click on the Image for a details
Dealership data contained in this document has been obtained from the eProfitFocus database. Over 800 dealers across Australia have contributed towards this data.
© 2016 Deloitte Motor Industry Services Pty Ltd
General Information Only
This presentation contains general information only, and none of Deloitte Touche Tohmatsu Limited, its member firms, or their related entities (collectively the “Deloitte Network”) is, by means of this presentation , rendering professional advice or services.
Before making any decision or taking any action that may affect your finances or your business, you should consult a qualified professional adviser. No entity in the Deloitte Network shall be responsible for any loss whatsoever sustained by any person who relies on this presentation.
About Deloitte
Deloitte refers to one or more of Deloitte Touche Tohmatsu Limited (“DTTL”), its global network of member firms, and their related entities (collectively, the “Deloitte organization”). DTTL (also referred to as “Deloitte Global”) and each of its member firms and related entities are legally separate and independent entities, which cannot obligate or bind each other in respect of third parties. DTTL and each DTTL member firm and related entity is liable only for its own acts and omissions, and not those of each other. DTTL does not provide services to clients. Please see www.deloitte.com/about to learn more.
Deloitte Asia Pacific Limited is a company limited by guarantee and a member firm of DTTL. Members of Deloitte Asia Pacific Limited and their related entities, each of which are separate and independent legal entities, provide services from more than 100 cities across the region, including Auckland, Bangkok, Beijing, Hanoi, Hong Kong, Jakarta, Kuala Lumpur, Manila, Melbourne, Osaka, Seoul, Shanghai, Singapore, Sydney, Taipei and Tokyo.
This communication contains general information only, and none of Deloitte Touche Tohmatsu Limited (“DTTL”), its global network of member firms or their related entities (collectively, the “Deloitte organization”) is, by means of this communication, rendering professional advice or services. Before making any decision or taking any action that may affect your finances or your business, you should consult a qualified professional adviser.
No representations, warranties or undertakings (express or implied) are given as to the accuracy or completeness of the information in this communication, and none of DTTL, its member firms, related entities, employees or agents shall be liable or responsible for any loss or damage whatsoever arising directly or indirectly in connection with any person relying on this communication. DTTL and each of its member firms, and their related entities, are legally separate and independent entities.