


Issues Emerging in Dealer Profitability
Marionne Sooriakumar | 26 February 2014
In the final Motor Industry Alert for 2013, we summarised the prominent events that our industry faced last year. From the announcements of closures in local automotive manufacturing plants to changes in legislation, 2013 was an interesting year for the motor industry.
With the reporting into the ProfitFocus database now completed for December month, we can start to see how dealer profitability fared in this environment.
A detailed review will be offered in our annual Industry Overview presentations in March, but we can already say that some of the key themes in 2013 were:
- Record sales but declining new vehicle grosses
- Increasing New Vehicle Days Supply at the dealership
- Finance and insurance beginning to plateau
Record sales but declining grosses – what is the net effect on dealer profitability?
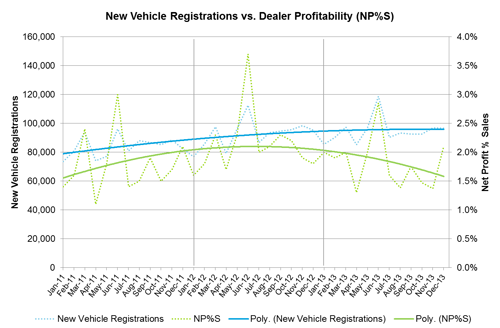
According to the Federal Chamber of Automotive Industries (FCAI), the final count in new vehicle registrations for 2013 was 1,136,227 – another record breaking year with a 2.17% increase on 2012.
However, did the record sales year translate to improvements in profitability for the average dealer?
The movement of net profit as a percentage of sales (NP%S) in 2013 indicates that dealer profitability declined despite the growth in sales volumes. In fact, the correlation between new vehicle registrations and NP%S that we had seen in previous years began to breakdown in 2013.
Drilling further into the decline in dealer profitability leads us to the volume-gross equation in selling new vehicles. As explored in our Motor Industry Alert earlier this year, the additional volume being pushed into the market is no longer offsetting the downward pressure that the resulting competition is having on gross margins. As a result the total gross profit pool in the new vehicle department has diminished and recovering semi-fixed costs has become increasingly difficult.
As dealers look forward, the focus will need to be on managing the volume push and identifying opportunities in this kind of market. With the FCAI predicting further growth in new vehicle volumes in 2014, the impact that this will have on grosses will be an important trend to follow.
Increasing stock levels
Last year saw a trend of increasing new vehicle stock for the average dealer. Our article What is happening to new car stock? explored the movements in new vehicle days supply (i.e. the units of stock held by a dealer at the end of a month divided by the average number of units that dealer sold each day of the month) under the prevailing “volume push” market conditions.
2012 |
2013 |
Variance ±% |
|
Volume |
61 days | 69 days | +13% |
Prestige |
62 days | 69 days | +11% |
Luxury |
59 days | 71 days | +20% |
The average dealer in the volume and prestige market is holding around 10 more days supply than a year ago, while the average dealer in the luxury market is holding roughly the same level of supply.
The increased stock levels in 2013 did not necessarily have a negative impact on new car profitability, as we noted that many of the top performing dealers in the market actually had similar stock holdings to the average dealer for particular brands. As such, 2013 reinforced the message that effective stock management is a key component of new car operations, where dealers should tailor their stock holding to their customer base and floor plan arrangements.
Finance and insurance has begun to soften
Finance and insurance has become an increasingly important part of dealership operations over the past few years, often offsetting the declining profitability in other departments to leave dealership profit at unchanged levels.
While this was no different in 2013, with the F&I contribution to dealership gross profit increasing by 2.2 percentage points on prior year to reach 21.0%, there are signs that F&I has begun to soften.
Both finance income per contract and finance penetration rates have remained at relatively constant levels over 2013, contrasting the past few years of rapid growth in these KPIs. Both these measures combine when reflected as F&I income per vehicle retailed, which has stayed around the $1,000 mark for the average dealer since the third quarter of 2012.
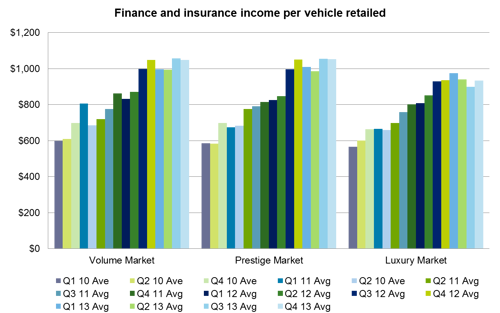
The above could be a reflection of stagnation in the F&I process at the dealership level despite there being increased opportunities from the volume push market. Or it could be an indication of the F&I market settling. Nevertheless, the challenge for dealers will be to find new growth opportunities should F&I continue to plateau.
2013 – A challenging year
As explored above, the biggest story for dealer profitability in 2013 was the shift in the volume and gross equation. With the “volume push” market pushing volume up and new vehicle grosses down, and F&I not covering the short fall in gross profit – this made it a challenging year for dealers to remain profitable.
This led average NP%S to be 1.9% in 2013, a 13.6 percent decrease on the result of 2.2% in 2012.
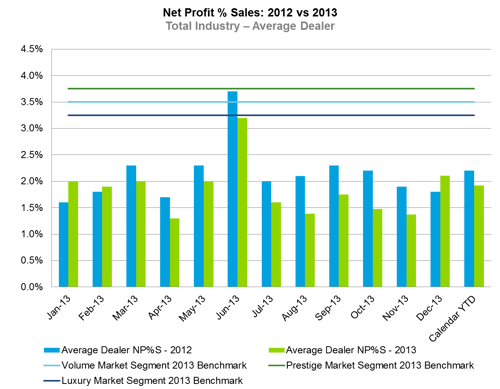
Despite the ‘tapping out’ of these front end sources of gross profit, the best performers maintained an edge on the average dealer earning $416 more in gross per retail unit and $194 more in new finance dollars per contract. Furthermore, many of them continued to focus on used cars.
Look forward to the annual Deloitte Motor Industry Services Industry Overview in March and the accompanying Motor Industry Update for our full review of 2013.
General Information Only
This presentation contains general information only, and none of Deloitte Touche Tohmatsu Limited, its member firms, or their related entities (collectively the “Deloitte Network”) is, by means of this presentation , rendering professional advice or services.
Before making any decision or taking any action that may affect your finances or your business, you should consult a qualified professional adviser. No entity in the Deloitte Network shall be responsible for any loss whatsoever sustained by any person who relies on this presentation.
About Deloitte
Deloitte refers to one or more of Deloitte Touche Tohmatsu Limited (“DTTL”), its global network of member firms, and their related entities (collectively, the “Deloitte organization”). DTTL (also referred to as “Deloitte Global”) and each of its member firms and related entities are legally separate and independent entities, which cannot obligate or bind each other in respect of third parties. DTTL and each DTTL member firm and related entity is liable only for its own acts and omissions, and not those of each other. DTTL does not provide services to clients. Please see www.deloitte.com/about to learn more.
Deloitte Asia Pacific Limited is a company limited by guarantee and a member firm of DTTL. Members of Deloitte Asia Pacific Limited and their related entities, each of which are separate and independent legal entities, provide services from more than 100 cities across the region, including Auckland, Bangkok, Beijing, Hanoi, Hong Kong, Jakarta, Kuala Lumpur, Manila, Melbourne, Osaka, Seoul, Shanghai, Singapore, Sydney, Taipei and Tokyo.
This communication contains general information only, and none of Deloitte Touche Tohmatsu Limited (“DTTL”), its global network of member firms or their related entities (collectively, the “Deloitte organization”) is, by means of this communication, rendering professional advice or services. Before making any decision or taking any action that may affect your finances or your business, you should consult a qualified professional adviser.
No representations, warranties or undertakings (express or implied) are given as to the accuracy or completeness of the information in this communication, and none of DTTL, its member firms, related entities, employees or agents shall be liable or responsible for any loss or damage whatsoever arising directly or indirectly in connection with any person relying on this communication. DTTL and each of its member firms, and their related entities, are legally separate and independent entities.