


2014 Australian Motor Industry Overview
Deloitte Motor Industry Services | 31 March 2014
The Year that was
If you tried to sum up 2013 in a headline, it might be something like this:
“It’s never been easier to sell cars, but harder to make a profit”
Now this needs to be put in some context. Was it easy to sell cars? Absolutely not! But was it easier in 2013 than some of the more recent years? Well, yes it appeared to be: the market generated record sales again in 2013, with 2.2% growth on 2012.
In contrast, dealer profitability in 2013 – that is net profit as a % of sales – did not improve over the prior year. For most dealers 2013 was a game of two halves: far stronger in the first 6 months than the second.
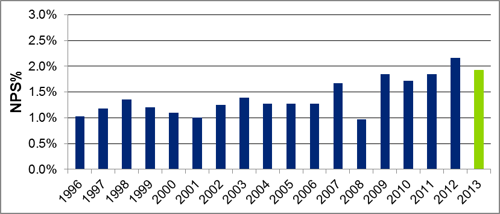
Last year was still, however, far better than a decade ago. In fact, it was the second highest industry-wide average Net Profit % Sales since we started measuring this in the eProfitFocus database in the mid-1990’s.
One of the factors driving dealer profitability over the last couple of years is that Australia remained a tempting place for the global car giants. With the financial pressure of patchy performances in the European economies and the need for global manufacturers to keep their factories going, the stable Australian market was seen as a natural place to drive some of the extra vehicles needed to underpin their supply chains.
The impact hit both distributors and retail dealers alike. The distributors battled to balance excess stock holding costs with managing dealer relations by coming up with new innovative ways to incentivise the shifting of stock to end customers. While dealers – well they gulped hard every time the trucks arrived, knowing the new vehicle gross profit from the artificially supported new car volumes would be unlikely to cover the increasing costs in their showroom.
What happened to dealer profitability?
So maybe it was “easier” to sell cars in 2013, but it definitely felt like harder work generating gross profit, particularly from the front end of the business. With the market growing by 2.2% over 2012 to reach 1,136,227 units, profitability for the average dealer in Australia fell by 17%.
That’s amazing to think: in a growing market, the profit of the average dealer fell.
The question therefore lingers, does new car volume drive profit?
During 2013 – at least up until June 2013 – there was a fairly direct relationship between new car volumes and dealer profitability. This is never clearer than in June where both volume and profits peaked together. Yet during the back half of 2013 and we saw volatility in the relationship between profitability and new car volume.
So does new car volume equate to profit? Our broad answer to this will always be “YES!” Not all profit in a dealership comes immediately from the sale of new cars. In fact, for the average dealer, most of their profit now comes from Finance & Insurance and Fixed Operations – these revenue streams are all by-products of selling new cars in the first place, and therefore, they depend absolutely new cars being sold.
However, the Australian new car market at the moment is a “push” market, along with this has come a greater dependence by dealers on factory bonuses and incentives, and it is fair to say that this whole equation has not necessarily worked for the profitability of all dealers.
A game of two halves
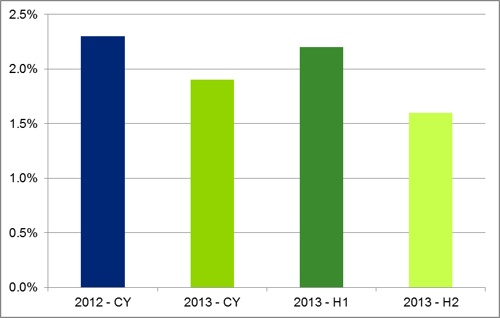
While profit for the average Australian dealer in 2013 reduced by 17% from the previous year (from 2.3% in 2012 to 1.9% in 2013), this did not tell the full story as 2013 was very much a game of 2 halves. For the first half of 2013, the average dealer saw a NPS% of 2.2%. However, this fell by almost 30% in the second half of the year to just 1.6%.
So what happened?
There were two things that changed for the average dealer in the second half of 2013. The first was that new car gross profit margins declined. The second was that the levels of stock in the industry increased.
Put simply, the situation was: lower new car gross margins, higher holding costs.
So where did a dealer’s profit come from?
It’s not something that dealers look at all that often, but if we allocate dealership overheads across the business on the basis of gross profit in each department, to get to a net profit by department the results are quite startling.
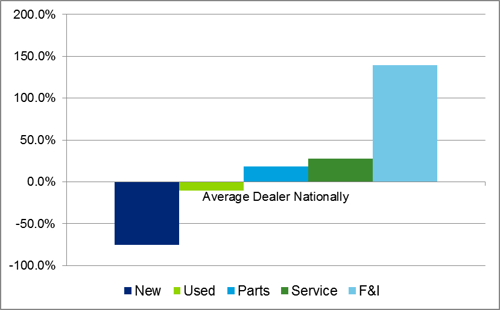
To start, the average dealer in 2013 lost money selling new cars. In fact, if we think of a hypothetical dealership which made a total net profit of $100 for the year, the new car department would have “contributed” a loss of -$75 towards that total!
The used car department of the average dealer was only slight better, losing -$11 for our hypothetical Dealer Principal, while the Parts department would have generated a grand total of $19 in net profit, and the Service Department just short of $30 net profit.
Across these four core departments, therefore, our hypothetical dealer actually lost around -$40.
So how did this hypothetical dealership move from a loss of -$40 to a total net profit of $100?
Essentially, through Finance & Insurance, with a little bit of miscellaneous “Other Income”. In fact, the average dealer has become so dependent on F&I that it now contributes 140% of their net profit!
This creates an immediate and urgent challenge for the average dealer: if new car gross profit continues to decline because of the competitive market, where will they make up the difference now?
Planning to succeed
While we can look at any number of KPIs to see how the best performing dealers are operating, it is more important to understand why these dealers are able to operate in such a way. The simple fact is that these things do not come about by accident. The top dealers plan for their success.
Everything in their business, from their marketing when they first reach out to potential customers, through all aspects of their day to day dealership operations as they serve those customers, is aligned with their overall business strategy and objectives. They then underpin all of this with solid business processes that are focussed on delivery and adhered to with strict discipline.
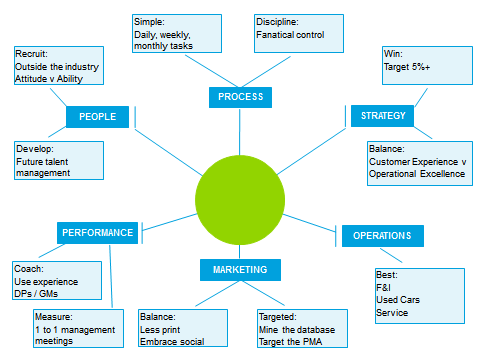
But really, at the end, they know that it is the people that make a difference.
It is people who make everything in the dealership happen – they develop the strategy, target the marketing, answer the phone enquiries, sell the cars, manage the service reminders, book the service, do the drive-way upsell, manage the parts inventory, handle the odd disgruntled customer, mine the database for repeat business and represent the business every single day.
So the very best dealers realise that they need to focus on recruiting the right people in the first place, then invest in developing those people and supporting them with on-going performance management structures.
They get that they are not in the car industry, they are in the people industry, and ultimately people sell cars, cars do not sell cars…just yet!
It does need a focussed mind, but the opportunities are there.
This has been an extract from the Deloitte Motor Industry Services 2014 Australian Motor Industry Overview. The full version can be downloaded here.
General Information Only
This presentation contains general information only, and none of Deloitte Touche Tohmatsu Limited, its member firms, or their related entities (collectively the “Deloitte Network”) is, by means of this presentation , rendering professional advice or services.
Before making any decision or taking any action that may affect your finances or your business, you should consult a qualified professional adviser. No entity in the Deloitte Network shall be responsible for any loss whatsoever sustained by any person who relies on this presentation.
About Deloitte
Deloitte refers to one or more of Deloitte Touche Tohmatsu Limited (“DTTL”), its global network of member firms, and their related entities (collectively, the “Deloitte organization”). DTTL (also referred to as “Deloitte Global”) and each of its member firms and related entities are legally separate and independent entities, which cannot obligate or bind each other in respect of third parties. DTTL and each DTTL member firm and related entity is liable only for its own acts and omissions, and not those of each other. DTTL does not provide services to clients. Please see www.deloitte.com/about to learn more.
Deloitte Asia Pacific Limited is a company limited by guarantee and a member firm of DTTL. Members of Deloitte Asia Pacific Limited and their related entities, each of which are separate and independent legal entities, provide services from more than 100 cities across the region, including Auckland, Bangkok, Beijing, Hanoi, Hong Kong, Jakarta, Kuala Lumpur, Manila, Melbourne, Osaka, Seoul, Shanghai, Singapore, Sydney, Taipei and Tokyo.
This communication contains general information only, and none of Deloitte Touche Tohmatsu Limited (“DTTL”), its global network of member firms or their related entities (collectively, the “Deloitte organization”) is, by means of this communication, rendering professional advice or services. Before making any decision or taking any action that may affect your finances or your business, you should consult a qualified professional adviser.
No representations, warranties or undertakings (express or implied) are given as to the accuracy or completeness of the information in this communication, and none of DTTL, its member firms, related entities, employees or agents shall be liable or responsible for any loss or damage whatsoever arising directly or indirectly in connection with any person relying on this communication. DTTL and each of its member firms, and their related entities, are legally separate and independent entities.