


Half Yearly Industry Overview
Deloitte Motor Industry Services | 9 September 2013
June 2013 YTD – Half-Yearly Industry Overview
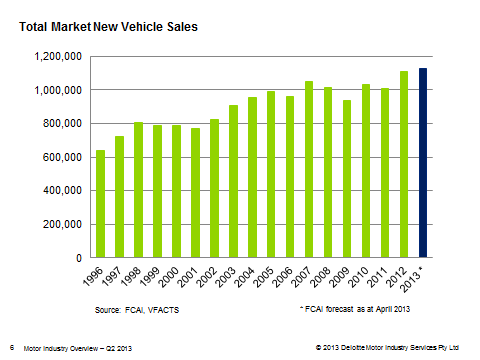
June 2013 was a record-breaking month in terms of registrations for the Australian motor industry. According to the Federal Chamber of Automotive Industries (FCAI), a total of 118,758 vehicles were registered. This monthly total was 5.5% higher than June 2012, the previous record.
On a year-to-date basis, the industry as a whole remains 4.7% above the same figure as at June 2012. This places the industry on track to eclipse the 2012 total calendar year figure of 1.11 million and record yet another milestone:
Did this flow through to dealers’ bottom lines?
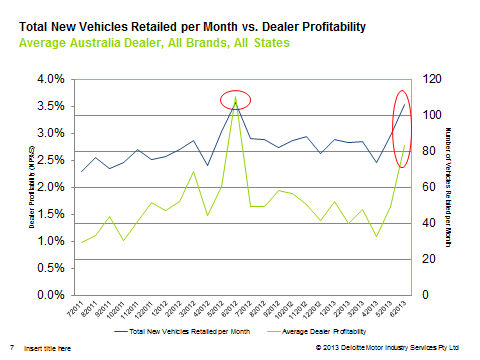
Data extracted from the ProfitFocus database indicates that dealer profitability follows the number of new vehicles registered to an extent. This is demonstrated on the chart overleaf for 2013 thus far:
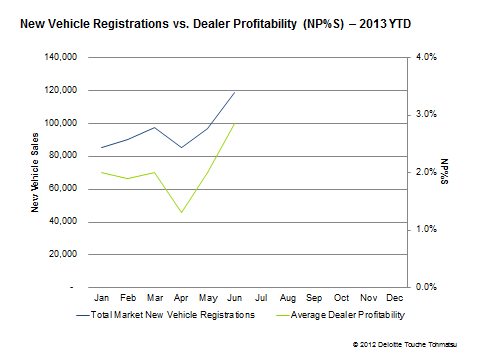
As illustrated above, dealer profitability for the average dealer steadily increased over the June 2013 quarter. The average dealer recorded 1.3%, 2.0% and 3.2% net profit as a percentage of sales for the months of April, May and June respectively. This trend was experienced across the volume, prestige and luxury market segments. It amounted to 2.1% for the June quarter as a whole. This coincides with the calendar year-to-date average.
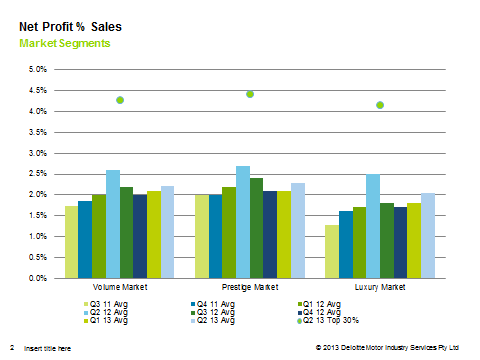
Compared to the quarter ended March 2013, dealer profitability lifted in the quarter ended June 2013. Whilst we are aware that the June quarter is synonymous with the recognition of target and/or KPI bonuses for various franchises, this increase was below the heights experienced in the June quarter last year across all market segments:
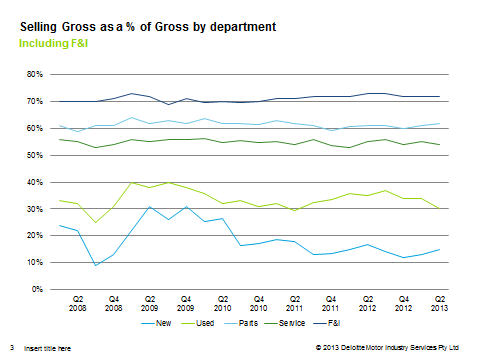
On a departmental basis, many of the trends previously identified have continued. The exception to this trend has been the new vehicle department. This is depicted in the below chart:
New Vehicle Department
The average dealer, across all brands, experienced uplift in new vehicle selling gross (as a percentage of new vehicle gross profit); from 13% in the quarter ended March 2013 to 15% in the quarter ended June 2013. This trend was particularly noticeable in the luxury market segment, increasing from 14% to 18% over the same period.
This movement has transpired despite the departmental gross profit margin as a percentage of departmental sales remaining constant at 7.0%. This suggests that the driving factor behind this increase was the increase in sales volume, which has contributed towards a relatively larger departmental gross profit pool.
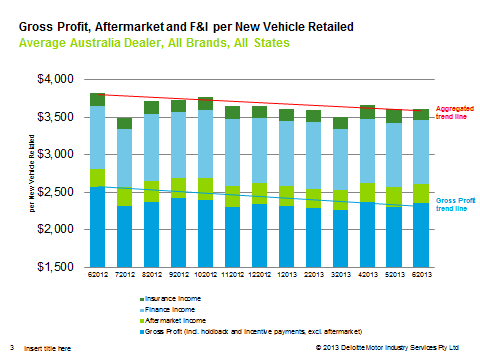
New vehicle gross profit margins for the average Australian dealer have trended downwards since early 2008. This trend has become increasingly noticeable since June 2012. Over this period, gross profit (including holdback and incentives) per new vehicle retailed has decreased from approximately $2,550 in June 2012 to $2,350 in June 2013.
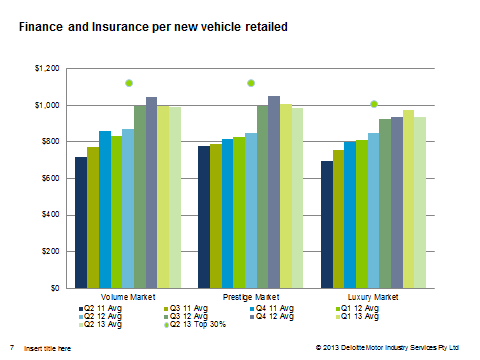
Historically, particularly over the period July 2011 – June 2012, additional F&I income offset this. However, as the growth in F&I income appears to be slowing, this is no longer is placing pressure on dealers, as demonstrated in the below chart:
The warning sign for dealers is that the additional volume they are achieving is no longer offsetting this overall decline in total (aggregated) income, as demonstrated below:
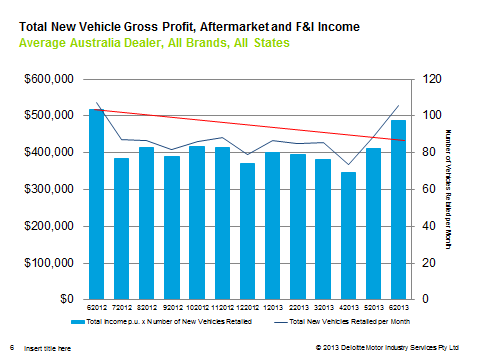
This trend has contributed towards the fact that even though new vehicle volumes in June 2013 were 4.7% higher than in June 2012, profitability for the average dealer (measured by net profit as a percentage of total sales) was actually lower:
Used Vehicle Department
Used vehicle department selling gross (as a percentage of used vehicle gross profit) has continued to trend downwards. This movement was observed across all market segments. For the first time since 2011, this metric fell to 30%. The contributory variable behind this decline was lower gross profit margins.
As a percentage of departmental sales, used retail gross profit margins slipped from 12.4% in the March 2013 quarter to 11.3% in the quarter ended June 2013.
Back-End
Back-end selling gross (as a percentage of gross profit) remained relatively unchanged from the quarter ended March 2013. Parts selling gross (as a percentage of parts gross profit) fractionally increased, from 61% to 62%.
Service selling gross (as a percentage of service gross profit) slightly contracted, from 55% to 54%. Gross profit margins (as a percentage of sales) were largely unchanged between these two quarters.
F&I Department
The F&I department remains the strongest at the selling gross (as a percentage of gross profit) line. For the quarter ended June 2013, F&I selling gross remained steady at 72%.
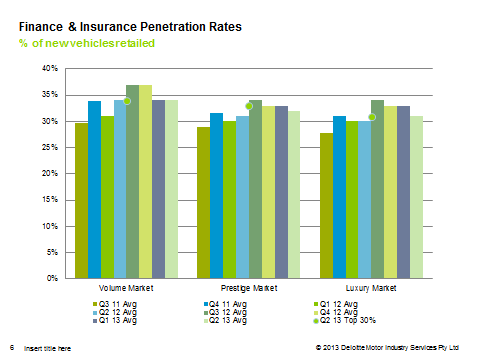
Above this bottom line, there are a number of interesting dynamics in the F&I department. Finance penetration rates have continued to trend downwards, a trend dating back to the end of the 2012 calendar year:
Further, overall F&I income per new vehicle retailed has in fact decreased for the average dealer across all market segments (volume, prestige and luxury). This is the first month of decline across all market segments in more than 2 years. Whilst this may partly be a function of higher new vehicle sales volumes, it may also be indicative of other broader economic movements (e.g. cash rates):
Looking Ahead
History tells us that new vehicle registrations remain relatively stable from July through to the end of the calendar year. Over this period, dealer profitability gradually works its way up, with a suitable lift in September before a larger spike in December.
Over this period of relative stability, dealers and manufacturers have an opportunity to consolidate on good practices learned in the first half of the year as well as look to improve some aspects that may have slipped off. It appears likely that achieving volume will not be the key issue for most dealers. Rather, lead conversion, gross profit margins (particularly in the front-end) and service retention (particularly, at 3-year and beyond existing customers) will be areas of focus.
General Information Only
This presentation contains general information only, and none of Deloitte Touche Tohmatsu Limited, its member firms, or their related entities (collectively the “Deloitte Network”) is, by means of this presentation , rendering professional advice or services.
Before making any decision or taking any action that may affect your finances or your business, you should consult a qualified professional adviser. No entity in the Deloitte Network shall be responsible for any loss whatsoever sustained by any person who relies on this presentation.
About Deloitte
Deloitte refers to one or more of Deloitte Touche Tohmatsu Limited (“DTTL”), its global network of member firms, and their related entities (collectively, the “Deloitte organization”). DTTL (also referred to as “Deloitte Global”) and each of its member firms and related entities are legally separate and independent entities, which cannot obligate or bind each other in respect of third parties. DTTL and each DTTL member firm and related entity is liable only for its own acts and omissions, and not those of each other. DTTL does not provide services to clients. Please see www.deloitte.com/about to learn more.
Deloitte Asia Pacific Limited is a company limited by guarantee and a member firm of DTTL. Members of Deloitte Asia Pacific Limited and their related entities, each of which are separate and independent legal entities, provide services from more than 100 cities across the region, including Auckland, Bangkok, Beijing, Hanoi, Hong Kong, Jakarta, Kuala Lumpur, Manila, Melbourne, Osaka, Seoul, Shanghai, Singapore, Sydney, Taipei and Tokyo.
This communication contains general information only, and none of Deloitte Touche Tohmatsu Limited (“DTTL”), its global network of member firms or their related entities (collectively, the “Deloitte organization”) is, by means of this communication, rendering professional advice or services. Before making any decision or taking any action that may affect your finances or your business, you should consult a qualified professional adviser.
No representations, warranties or undertakings (express or implied) are given as to the accuracy or completeness of the information in this communication, and none of DTTL, its member firms, related entities, employees or agents shall be liable or responsible for any loss or damage whatsoever arising directly or indirectly in connection with any person relying on this communication. DTTL and each of its member firms, and their related entities, are legally separate and independent entities.