Dealer Profitability Report
The Dealer Profitability Report provides a dynamic overview of your dealership’s performance and allows you to compare yourself to other dealers from 'top to bottom'.
The breadth of the eProfitFocus database allows you to create a ‘composite’ – or group of dealers – that have similar trading circumstances to you. Choose the state, region, brands and performance status (average or best performer) of dealers you would like to compare to.
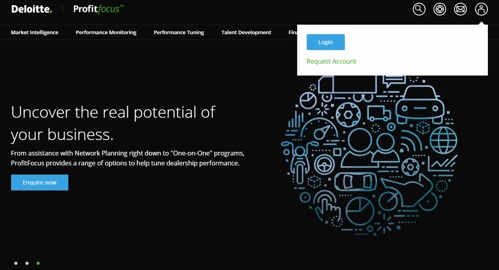
Step 1 Log In
Log in to the secure area of the eProfitFocus website via the top right-hand side of the www.eprofitfocus.com homepage.
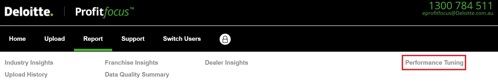
Step 2 Find the report
Once logged in, click on the Dealer Profitability Report under the Report > Performance Tuning menu. This will take you to the report criteria selection page.
Step 3 Choose the data type
Note that there will be two versions of the Dealer Profitability Report:
- PFD010 shows Franchise data: Uses only the reporting franchise specific data i.e. the brand for which you are reporting on eProfitFocus
- PTD010 shows Total Dealership data: Uses the data for the entire dealership
For further information on the difference between franchise data and total dealership data, see here.
Step 4 Select the report period
This section reflects your dealership’s submitted data.
Choose two periods that you would like to view your performance for. Common selections include:
- Comparing your latest month to the average across the rest of the year
- Comparing your average performance so far this year to your average performance for the same time last year
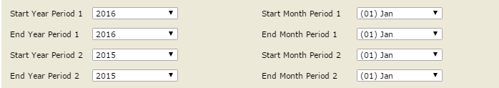
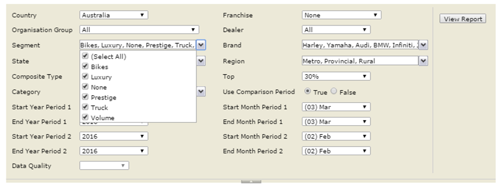
Step 5 Select your preferences for the Composite group
This section reflects other dealers’ submitted data.
Choose the period for which you would like your composite to be based on. Then choose the characteristics of the group that you would like to compare to:
a) State
Do you want to compare yourself to dealers across the country or just in your own state?
b) Region
Do you only want to compare against dealers in similar regions to you – whether that be metro, provincial or rural?
c) Segments and Brands
Are you interested in a particular segment of the market? In the brands you sell or competitor brands? With PTD010 you can choose composite groups at a segment and brand level
Note: This section is only available for the Total Dealership version of the report (i.e. PTD010) as noted in Step 3. If you select the Franchise Data version of the report (i.e. PFD010), your composite will reflect the franchise data of the dealers in the network for your reporting franchise.
d) Composite Type
Do you want to compare yourself to the average or the best performers? If it’s the best performers, how do you measure the ‘best’?
- Average: Will provide you the average of the performance of all dealers in the state, region, and franchises you have selected
- Net Profit % Sales: Will rank the dealers in the state, region and franchises you have selected by net profit % sales (the most holistic measure of profitability), and then provide you either the Top 5, Top 10, Top 20% or Top 30% (depending on what you select under the Top filter)
- Department Selling Gross: Will rank the dealers in the state, region and franchises you have selected by their performance in a particular department (new, used, parts or service), and then provide you either the Top 5, Top 10, Top 20% or Top 30% (depending on what you select under the Top filter).
Step 6 Select the categories you would like to explore
Unlike traditional reports, where you have to run the entire report together, the Top to Bottom Comparative report allows you to choose up to nine Categories. You can choose just one, or select any combination of Categories that meets your needs.
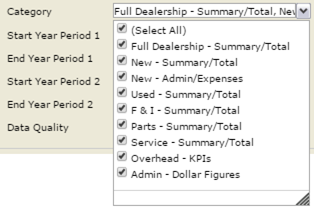
These categories are broadly broken down by department and allow you to focus on just those areas you are interested in reviewing. They also allow you to jump from one department to another quickly and easily without having to run the whole report.
A word about performance: The Dealer Profitability Report is effectively 9 reports in one. Like any report, the more data you pass through the report, the longer it will take to run. Choosing one or two Categories for 3 months for a medium size network should comfortably run within 30 - 45 seconds (depending on system load and the exact Categories chosen). However, choosing all 9 categories for 12 months for a large network will naturally take longer, and could be in excess of 5 or 6 minutes in extreme cases.
Step 7 Click create!
When you are ready, click 'View Report' to generate the report.
Note: If your selections result in a pool of fewer than five dealers in any group (e.g. region or state), the report will run, but show "Not Available". This is done to maintain the confidentiality of individual dealer's information when the groups get too small.
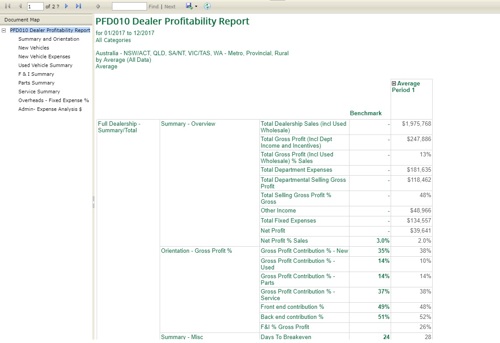
Step 8 Explore and Export (if needed)
As these reports are dynamic reports, once you have the report on screen you can explore them to get to the information you need.
Use the document map on the left of the screen to move between pages (if you have run the report for more than one Category). Simply click on the link to be taken directly to the page you need.
You can also drill into the time periods you have run by clicking on the ' + ' symbol in the column headings in the report.