

Franchise Insights Reports
Franchise Insights
Franchise Profitability
A high-level summary of the financial performance of dealerships within your network.

How to run this report:
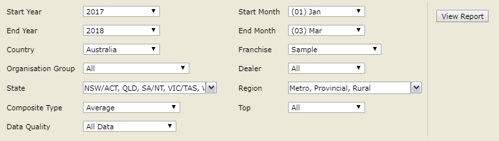
- Once logged in, click on Industry Profitability under the 'Report Tab'.
- Select your report criteria using the filter options available to your login. To learn more about report filters, click here.
- Click view report.
- Your report will be created and can be viewed either on screen or exported to Excel or PDF. As a 'dynamic' report, you are able to interactively drill down to get different levels of information detail:
- Drill down sales, gross profit and department selling gross to get these indicators by department
- Drill down the states to get additional region detail
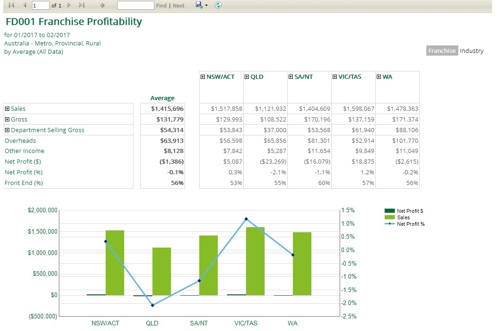
How to read and use this report:
Report format:
- Left-hand side, top-to-bottom: High-level KPIs with sales, gross profit and selling gross expandable to provide a department view.
- Right-hand side, left-to-right: Franchise average (grey) and states expandable to provide a region view.
Key areas to look out for:
Which departments are contributing the most to gross profit in each state?
Are margins (department gross profit / department sales) stable. improving or declining?
- Run a series of reports over different periods e.g. by quarter or by month.
- Expand both Sales and gross Profit to see the department breakdown.
- Calculate margins by department and identify the trend.
Is dealer profitability (net profit % sales) stable, improving or declining?
- Run a series of reports over different periods e.g. by quarter or by month
- Note the NP%S figure and identify any trends. Use the same reports to see if there have been any trends in other areas e.g. gross profit, other income etc.