Industry Profitability
Introduction
eProfitFocus’ Dynamic KPI Reports are a powerful tool that allows you to make timely, value adding decisions that make a real difference to your bottom line. The dynamic nature of the reports allow you to quickly analyse and compare your performance across different time periods, market segments, brands, regions – at both the high level or by department. Compare their performance against individual industry constituents, a national benchmark, and the industry average – highlighting areas of potential growth and market opportunity.
Industry Insights Reports vs Franchise Insights Reports
Dynamic reports can be run in two forms: industry or franchise. The industry version uses total dealership data (i.e. performance of the entire dealership). In contrast, the franchise version will only use reporting franchise specific data (i.e. the brand that you report to eProfitFocus with) and compare this to other dealerships that trade in the same franchise – also using only their reporting franchise specific data.
Guide to using Industry Profitability Report
Step 1
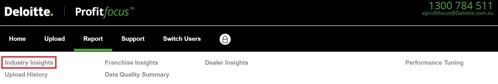
Once logged in, click on Industry Profitability – Dynamic under the ‘Report Tab’.
Step 2
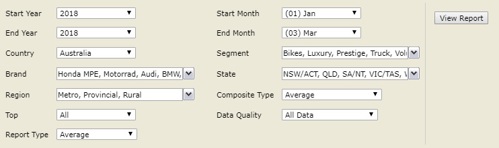
Tailor the dealerships/franchises (known as a composite group) for which a comparison would like to be made by selecting appropriate criteria.
Parameters
A) Time Period: A minimum of one month must be selected.
B) Country: Only dealerships from the country in which you trade will be selected for comparison.
C) Segment: Multiple market segments or a single market segment may be selected. ProfitFocus segments the market into volume, prestige, and luxury based on the consideration of volume and margin.
D) Brand: Multiple brands or a single brand may be selected. The brand parameter will default to an assortment of brands based on the 'segment’ selection – however, customisation is allowable.
E) State: Only dealerships from your selection of states will be selected for comparison. To show national performance, simply ‘Select All’ for this criterion.
F) Region: Multiple regions or a single region may be selected. If ‘Metro’ is selected, the report will only compare the user’s dealership against metro dealerships.
G) Composite Type: Composite type is the key metric by which dealerships are ranked. If ‘Net Profit % Sales (i.e. return on sales), New, Used, Parts or Service’ are selected, only the dealerships that have performed the strongest by bottom line or the respective department will be included in the report – the rest will be excluded. If ‘Average’ is selected, all dealerships that meet your state, brand and region selection above in the database will be included in the report – no dealerships will be excluded.
H) Top: Defines how many of the top dealers when ranked by ‘Net Profit % Sales, New, Used, Parts or Service’ are included in your report.
Step 3
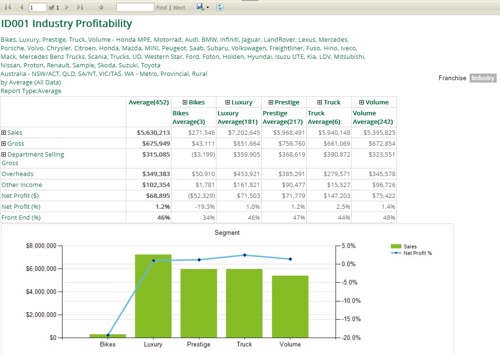
After clicking view report, a graph containing the key metrics and a profitability summary table will be displayed. Sales revenue, gross profit and department selling gross profit can all be expanded – detailing the composition of their total values. Similarly, segment, which runs across the top, can also be expanded. Doing so will display the franchises within the segment and their performance across the respective profitability categories.
Step 4
The report can be saved by clicking on the ‘Export’ button contained within the report. The report may be saved in any number of formats, including Excel and PDF.