

December 2014 Dealer Profitability
Deloitte Motor Industry Services | 1 January 2015
Total Industry
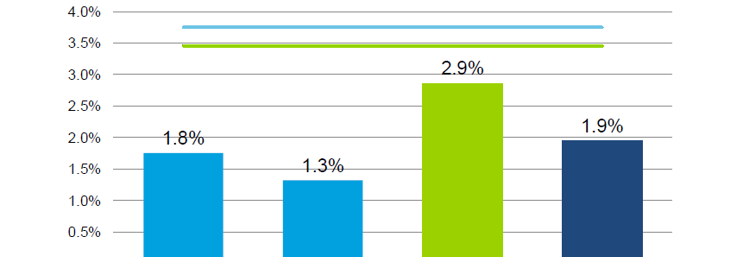
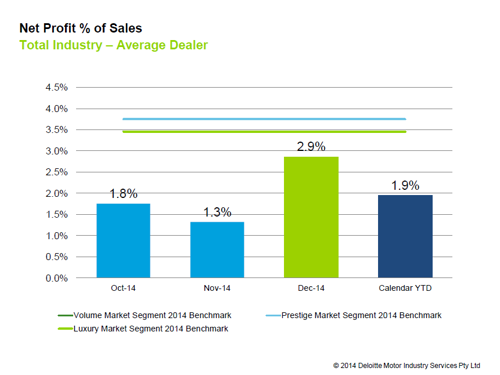
Dealer profitability as measured by net profit as a percentage of sales (NP%S) was 2.9% for the average Australian dealer in December 2014. The result was the highest of the months in the last quarter of the calendar year. Other income as a percentage of total dealership gross profit for the average dealer was 15% in the month of December, compared to the year-to-date result of 11%.
Comparing year-on-year, average dealer profitability improved marginally in 2014. The calendar YTD result of 1.94% in 2014 was 0.02 percentage points above the 2013 average. It is worth noting that the best performing dealers (i.e. top 30%) improved by 0.2 percentage points between years with these dealers achieving an NP%S of 3.9% in 2014.
State-by-State
New South Wales/Australian Capital Territory
The average NSW/ACT dealer NP%S was 2.8% in December and an average of 1.9% for the calendar year – a 0.3 percentage point increase on the 1.6% result of 2013.
Comparing year-on-year, new vehicle grosses recovered in 2014 with gross per new vehicle retailed for the average dealer in the region increasing from $1,793 in 2013 to $2,307 in 2014. This combined with NSW being the only state/territory to experience uplift on market volumes year-on-year, new vehicle profitability (as measured by selling gross as a percentage of gross) showed improvement from 7% in 2013 to 13% in 2014.
Queensland
QLD was the most profitable state for the December month with an NP%S of 3.7% for the average dealer, and the second most profitable state for the year with a calendar YTD result of 2.2% in 2014.
Finance and insurance (F&I) was a strength for the state in 2014 with the average dealer in QLD outperforming the industry average in both penetration and income per contract. The average QLD dealer earned $933 in F&I income per new vehicle retailed and $987 per used vehicle retailed – with this being $78 and $179 more than the average across the country.
South Australia/Northern Territory
SA/NT was the most profitable state in 2014 with a calendar YTD NP%S of 2.2%, this including a strong closing month result of 3.5% for the average dealer in December 2014.
While the region performed above the industry average in terms of profitability for a number of departments, the new vehicle department performance was a key determinant for the SA/NT NP%S result in 2014. New vehicles contributed 39% to total dealership gross profit with average gross at $3,480 per new vehicle retailed. This contributed to the average dealer in SA/NT achieving a new vehicle selling gross as a percentage of gross result of 29%. When comparing to the industry average, this measure indicates that the average dealer in SA/NT retained 13% more in gross profit than the average dealer in the country.
Victoria/Tasmania
The average dealer in VIC/TAS achieved an NP%S of 1.7% in December, with this result being just above their calendar YTD NP%S of 1.6%.
Front end profitability continued to be the challenge for the average VIC/TAS dealer this year, with gross margins for new and used operations being 7.1% and 8.5% respectively – this compared to the industry averages of 7.4% and 11.3%. The impact to profitability from the comparatively smaller margins has in part been mitigated by effective expense control. Total dealership expenses (as a percentage of total dealership gross profit1) was 113% for the average dealer in the region, with this being 4.0 percentage points below the industry average.
However, the other factor at play has been that the average VIC/TAS dealer has not benefited from F&I as much as other regions with both penetration and income per contract lower than the industry average.
Western Australia
NP%S for the average WA dealer was 2.7% in December and 2.1% for the 2014 year. In line with economic growth relaxing in the state, the average dealership turnover contracted by 14% in 2014 when compared to 2013. While total dealership gross margin improved over the same period, the reduction in the gross profit pool did not match the reduction in fixed expenses ultimately impacting dealer profitability. Fixed expenses for WA sat at 55% for the average WA dealer compared to the industry average of 50%.
Segments
The luxury segment was the most profitable segment for the 2014 year with the YTD calendar result of 2.0%. This profitability was largely boosted by strong new vehicle performance that reflected both the recovery of grosses from last year as well as the strong sales growth and product of 2014.
The luxury segment was only a fraction above the prestige segment which also returned a calendar NP%S of 2.0% (when rounded). The average dealer in the volume segment was close behind with a result of 1.9% in 2014.
Click the chart below for more details.
General Information Only
This presentation contains general information only, and none of Deloitte Touche Tohmatsu Limited, its member firms, or their related entities (collectively the “Deloitte Network”) is, by means of this presentation , rendering professional advice or services.
Before making any decision or taking any action that may affect your finances or your business, you should consult a qualified professional adviser. No entity in the Deloitte Network shall be responsible for any loss whatsoever sustained by any person who relies on this presentation.
About Deloitte
Deloitte refers to one or more of Deloitte Touche Tohmatsu Limited (“DTTL”), its global network of member firms, and their related entities (collectively, the “Deloitte organization”). DTTL (also referred to as “Deloitte Global”) and each of its member firms and related entities are legally separate and independent entities, which cannot obligate or bind each other in respect of third parties. DTTL and each DTTL member firm and related entity is liable only for its own acts and omissions, and not those of each other. DTTL does not provide services to clients. Please see www.deloitte.com/about to learn more.
Deloitte Asia Pacific Limited is a company limited by guarantee and a member firm of DTTL. Members of Deloitte Asia Pacific Limited and their related entities, each of which are separate and independent legal entities, provide services from more than 100 cities across the region, including Auckland, Bangkok, Beijing, Hanoi, Hong Kong, Jakarta, Kuala Lumpur, Manila, Melbourne, Osaka, Seoul, Shanghai, Singapore, Sydney, Taipei and Tokyo.
This communication contains general information only, and none of Deloitte Touche Tohmatsu Limited (“DTTL”), its global network of member firms or their related entities (collectively, the “Deloitte organization”) is, by means of this communication, rendering professional advice or services. Before making any decision or taking any action that may affect your finances or your business, you should consult a qualified professional adviser.
No representations, warranties or undertakings (express or implied) are given as to the accuracy or completeness of the information in this communication, and none of DTTL, its member firms, related entities, employees or agents shall be liable or responsible for any loss or damage whatsoever arising directly or indirectly in connection with any person relying on this communication. DTTL and each of its member firms, and their related entities, are legally separate and independent entities.