

February 2015 Dealer Profitability
Marionne Sooriakumar | 1 March 2015
Total Industry
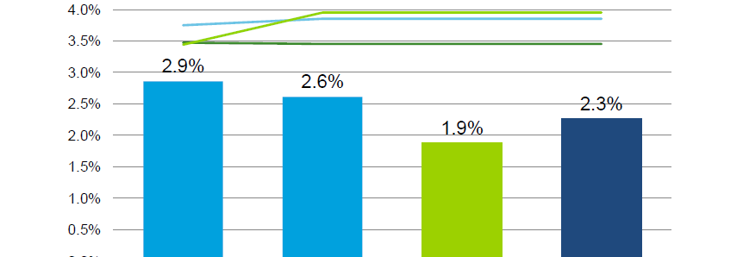
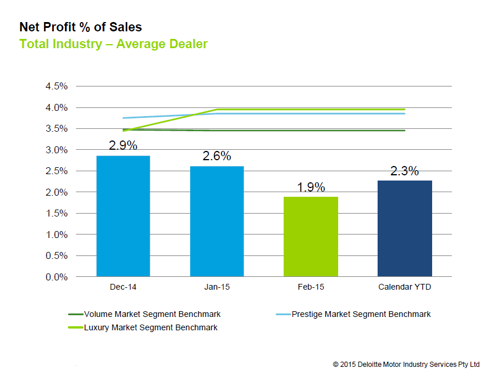
Dealer profitability as measured by net profit as a percentage of sales (NP%S) was 1.9% for the average Australian dealer in February 2015. While this result was a decline on the strong result of January 2015 (of 2.6%), it was stronger than the 1.7% of February 2014.
Sales revenue increased by 2% for the average dealer between January and February 2015, however net profit dollars decreased by 27% or about $32,200 between the same two months. The primary drivers to this decrease in net profit were reductions in Finance and Insurance (F&I) and Other Income earned by the average dealer.
Comparing year-on-year, the average Australian dealer returned 2.3% NP%S for the 2015 year so far (calendar YTD), which puts the industry ahead of where it was this time last year where the NP%S result sat at 2.0%.
State-by-State
New South Wales/Australian Capital Territory
The average NSW/ACT dealer returned an NP%S result of 1.6% in February, which was a 0.4 percentage point decline on the previous month.
NSW/ACT experienced the greatest decline month-on-month in F&I income (when compared to total dealership gross profit1) amongst all the state groups. While finance penetration rates remained constant between January and February, finance income earned per new and used contract written reduced by $401 and $150 respectively.
Comparing to last year however, the improvement to new car profitability has improved overall dealer profitability for the state group. The calendar YTD NP%S for the average NSW/ACT dealer was 2.0% at the end of February 2015 which was an improvement on the 1.8% returned at the end of February last year.
Queensland
QLD was the most profitable state for February month and for the 2015 year so far, with an NP%S of 2.7% and 3.0% respectively.
The strength of margins in the majority of the traditional departments (new, used and service) led total dealership gross profit as a percentage of total revenue of 13.5% for the average QLD dealer in February – a figure that was 0.5 percentage points above the industry average. However, it is also worth noting that dealership expenses as a percentage of this same gross profit for QLD was also amongst the highest in the state groups.
South Australia/Northern Territory
The average SA/NT dealer returned a NP%S of 1.9% in February and 2.2% for the calendar year.
The strength of the SA/NT state group continues to be in new vehicle performance with the average gross generated per new vehicle sold at $2,818 for the month of February compared to the industry average of $2,376 per unit.
It is worth noting that SA/NT was the only state to be less profitable in new cars on average when comparing the first two months of 2015 against the same period in 2014. While grosses were stronger in 2015, expenses per unit were greater by $213 in February 2015 compared to the same month last year.
Victoria/Tasmania
The average dealer in VIC/TAS achieved an NP%S of 2.0% in February and was the second most profitable state group for the month. Comparing 2015 to last year, dealer profitability has improved with the average VIC/TAS dealer returning an NP%S of 2.2% for the calendar 2015 year – which was 0.5 percentage points higher than the YTD result in 2014.
This improvement is a reflection of improved new car profitability with selling gross as a percentage of gross profit (a measure of how much gross profit is retained by the department after costs to sell have been taken away) improving from 18% in February 2014 to 22% in February 2015. This in turn was an outcome of higher grosses with the average dealer generating $366 more in gross for every new vehicle retailed.
Western Australia
Dealer profitability in WA fell to the lower levels experienced in the second half of 2014 with NP&S at 1.0% in February.
Margins in the “back end” have contracted when compared to last year, with this being reflected in the decline in parts and service profitability for the average WA dealer. In particular, much of this being attributed to parts salaries expenses have not reduced at the same rate as margins in the department. Ultimately the February month saw parts profitability as measured by selling gross (as a percentage of gross) decline from 62% in February last year to 55% in February 2015.
Segments
Profitability declined when compared to the previous month for the average dealer in the volume segment with NP%S at 1.9% in February. This result was still above the result returned in the same month last year where NP%S was 1.6%.
The luxury segment was the most profitable segment so far in 2015, with the average dealer returning 2.5% NP%S for the calendar year. Similar to the volume segment, the February month result of 2.2% was 0.4 percentage points above the NP%S returned for the same month in 2014.
The average dealer in the prestige segment returned an NP%S of 1.8% in February. Of the three segments it was the only one to not improve on its result for the same month in 2014.
Click the chart below for more details.
Dealership data contained in this document has been obtained from the eProfitFocus database. Over 800 dealers across Australia have contributed towards this data.
© 2015 Deloitte Motor Industry Services Pty Ltd
General Information Only
This presentation contains general information only, and none of Deloitte Touche Tohmatsu Limited, its member firms, or their related entities (collectively the “Deloitte Network”) is, by means of this presentation , rendering professional advice or services.
Before making any decision or taking any action that may affect your finances or your business, you should consult a qualified professional adviser. No entity in the Deloitte Network shall be responsible for any loss whatsoever sustained by any person who relies on this presentation.
About Deloitte
Deloitte refers to one or more of Deloitte Touche Tohmatsu Limited (“DTTL”), its global network of member firms, and their related entities (collectively, the “Deloitte organization”). DTTL (also referred to as “Deloitte Global”) and each of its member firms and related entities are legally separate and independent entities, which cannot obligate or bind each other in respect of third parties. DTTL and each DTTL member firm and related entity is liable only for its own acts and omissions, and not those of each other. DTTL does not provide services to clients. Please see www.deloitte.com/about to learn more.
Deloitte Asia Pacific Limited is a company limited by guarantee and a member firm of DTTL. Members of Deloitte Asia Pacific Limited and their related entities, each of which are separate and independent legal entities, provide services from more than 100 cities across the region, including Auckland, Bangkok, Beijing, Hanoi, Hong Kong, Jakarta, Kuala Lumpur, Manila, Melbourne, Osaka, Seoul, Shanghai, Singapore, Sydney, Taipei and Tokyo.
This communication contains general information only, and none of Deloitte Touche Tohmatsu Limited (“DTTL”), its global network of member firms or their related entities (collectively, the “Deloitte organization”) is, by means of this communication, rendering professional advice or services. Before making any decision or taking any action that may affect your finances or your business, you should consult a qualified professional adviser.
No representations, warranties or undertakings (express or implied) are given as to the accuracy or completeness of the information in this communication, and none of DTTL, its member firms, related entities, employees or agents shall be liable or responsible for any loss or damage whatsoever arising directly or indirectly in connection with any person relying on this communication. DTTL and each of its member firms, and their related entities, are legally separate and independent entities.