

June 2015 Dealer Profitability
Deloitte Motor Industry Services | 28 July 2015
Total Industry
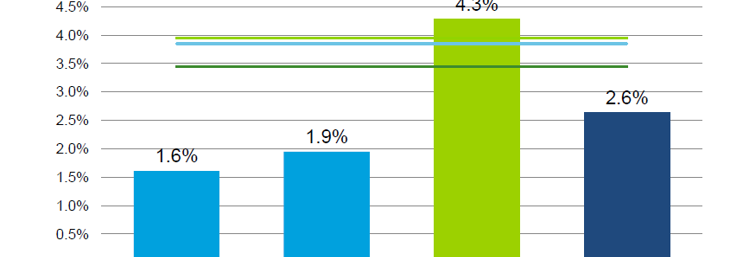
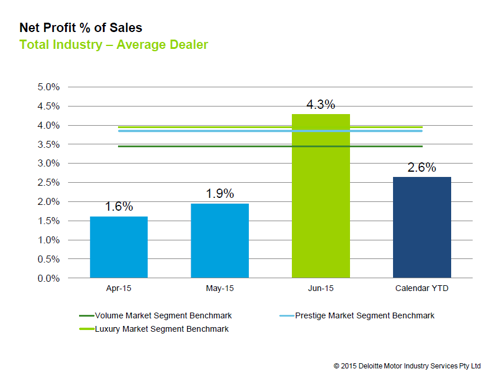
Dealer profitability as measured by net profit as a percentage of sales (NP%S) was 4.3% for the average Australian dealer in June 2015. This was 0.95 percentage points above the June 2014 result and one of the strongest monthly results seen across the industry over the past few years – driven by bonus income payments.
The calendar year-to-date (YTD) NP%S as at June 2015 was 2.6%, which was 0.4 percentage points above the result for the first half of 2014. The increase was primarily driven by improvements in new vehicle performance and better overhead cost control.
State-by-State
With the exception of WA, all state groups had a stronger first six months in 2015 compared to 2014.
- The average NSW/ACT dealer returned an NP%S of 4.1% in June 2015. The calendar YTD result of 2.4% was 0.4 percentage points above the performance of the first half of 2014 for the region – this was the greatest improvement of all the state groups. The improvement was driven by new vehicles with the growth in market volumes for NSW and ACT compared to 2014. The greater profitability in department operations is reflected in selling gross as a percentage of gross increasing from 14.6% (June 2014 YTD) to 19.8% (June 2015 YTD).
- QLD continued to outperform the industry average with an NP%S result of 5.7% for the average dealer in June and this leading to 3.6% NP%S as a calendar YTD result. This benchmark performance for the region is largely supported by F&I income but margins in other departments are also strong compared to the industry average.
- The SA/NT state group returned an average NP%S of 3.8% in June 2015 and an average of 2.6% across the first six months of 2015. Although there is a contraction in revenue when compared to last year, the average SA/NT dealer in the stage group continues to perform above industry average in new vehicle gross margins and profitability, however service gross margin at 62.1% (June 2015 YTD) was the lowest amongst the state groups.
- The average VIC/TAS dealer returned an NP%S of 3.5% in June and 2.2% for the calendar YTD. Along with QLD, the VIC/TAS state group exhibits the best overhead cost control with overheads consuming 46.3% of gross profit (not including F&I) – compared to the industry average of 47.5%.
- WA saw an average NP%S of 3.2% in June 2015 and 1.8% for the calendar YTD. While gross margins in almost all departments are above the industry average for the 2015 year so far, the contraction in turnover has reduced the gross profit pool available to recover expenses in the department.
Segments
Categorising the industry by market segment, dealers selling luxury segment brands continues to be the most profitable at 2.8% NP%S for the first half of 2015. The prestige segment followed at 2.7% average NP%S and the volume segment at 2.6%.
Click the chart below for more details.
Dealership data contained in this document has been obtained from the eProfitFocus database. Over 800 dealers across Australia have contributed towards this data.
© 2015 Deloitte Motor Industry Services Pty Ltd
General Information Only
This presentation contains general information only, and none of Deloitte Touche Tohmatsu Limited, its member firms, or their related entities (collectively the “Deloitte Network”) is, by means of this presentation , rendering professional advice or services.
Before making any decision or taking any action that may affect your finances or your business, you should consult a qualified professional adviser. No entity in the Deloitte Network shall be responsible for any loss whatsoever sustained by any person who relies on this presentation.
About Deloitte
Deloitte refers to one or more of Deloitte Touche Tohmatsu Limited (“DTTL”), its global network of member firms, and their related entities (collectively, the “Deloitte organization”). DTTL (also referred to as “Deloitte Global”) and each of its member firms and related entities are legally separate and independent entities, which cannot obligate or bind each other in respect of third parties. DTTL and each DTTL member firm and related entity is liable only for its own acts and omissions, and not those of each other. DTTL does not provide services to clients. Please see www.deloitte.com/about to learn more.
Deloitte Asia Pacific Limited is a company limited by guarantee and a member firm of DTTL. Members of Deloitte Asia Pacific Limited and their related entities, each of which are separate and independent legal entities, provide services from more than 100 cities across the region, including Auckland, Bangkok, Beijing, Hanoi, Hong Kong, Jakarta, Kuala Lumpur, Manila, Melbourne, Osaka, Seoul, Shanghai, Singapore, Sydney, Taipei and Tokyo.
This communication contains general information only, and none of Deloitte Touche Tohmatsu Limited (“DTTL”), its global network of member firms or their related entities (collectively, the “Deloitte organization”) is, by means of this communication, rendering professional advice or services. Before making any decision or taking any action that may affect your finances or your business, you should consult a qualified professional adviser.
No representations, warranties or undertakings (express or implied) are given as to the accuracy or completeness of the information in this communication, and none of DTTL, its member firms, related entities, employees or agents shall be liable or responsible for any loss or damage whatsoever arising directly or indirectly in connection with any person relying on this communication. DTTL and each of its member firms, and their related entities, are legally separate and independent entities.