

March 2015 Dealer Profitability
Deloitte Motor Industry Services | 27 April 2015
Total Industry
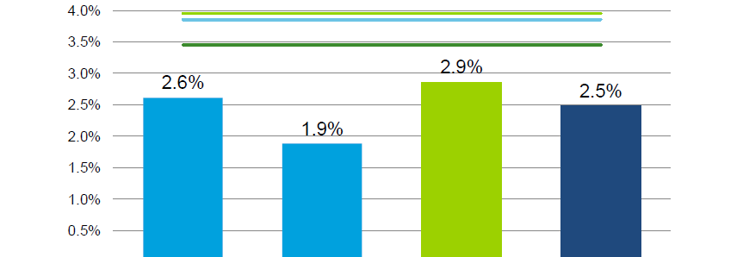
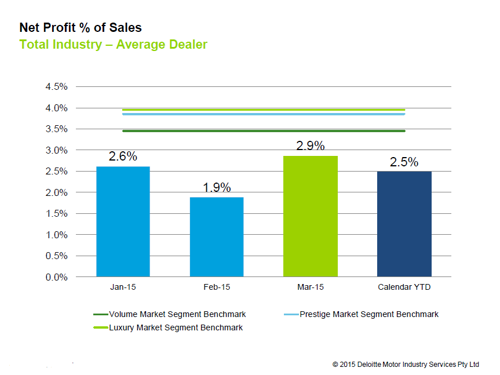
Dealer profitability as measured by net profit as a percentage of sales (NP%S) was 2.9% for the average Australian dealer in March 2015. This was a strong result when compared to March 2014 which was 2.3% and the same month for the three years prior as well.
The strength of the result in March raised the calendar year-to-date NP%S to 2.5% which was 0.5 percentage points above the position in the industry for the same time last year.
State-by-State
New South Wales/Australian Capital Territory
The average NSW/ACT dealer returned an NP%S result of 2.8% in March, which rounded out the quarter one (Q1) result at 2.3% for the state group. This was 0.3 percentage points ahead of the Q1 result for 2015.
NSW/ACT new vehicle performance in the first quarter was stronger in 2015 than in 2014. While new vehicle sales turnover experienced an uplift of 10% when comparing the two periods, the average dealer in the state group saw a slightly greater uplift in gross profit of 11%. This improvement in gross profit saw the new vehicle department being more profitable for the average dealer with departmental expenses consuming 75% of total gross profit in 2015, while in 2014 this figure was much higher at 84%.
Queensland
QLD was the most profitable state for the March month in 2015, with the average dealer returning benchmark levels of profitability at 3.8% NP%S. QLD dealers have so far been the most profitable across the year, with the Q1 result for 2015 at 3.3% NP%S.
Vehicle operations and F&I were the key determinants to the strong profitability result in 2015 so far. Comparing Q1 2015 and Q1 2014, the average QLD dealer saw both greater throughput and grosses in new, while in used vehicles, throughput was down 5% but average gross generated per used vehicle retailed improved by 16%. This in combination with an uplift of 14% to the amount of F&I income earned per new and used vehicle retailed, shows the strength of the front end for QLD dealerships at present.
South Australia/Northern Territory
Average dealer profitability for SA/NT dealers was 3.6% (NP%S) in March and 2.7% for Q1 in 2015. This Q1 NP%S result was 0.3 percentage points above the same period in 2014 which was 2.4%.
SA/NT dealers continue to be the strongest new vehicle performers amongst the state groups with new vehicle departmental profitability, as measured by selling gross, at 29% of gross profit. However, when comparing Q1 performance in 2015 to last year, SA/NT dealers have become less profitable due to an increase in departmental expenses. Notably, salaries expenses was the main area to increase as well as pre-delivery costs which increased by $54 per unit.
Victoria/Tasmania
The average VIC/TAS dealer returned an NP%S result of 2.3% in March which was just ahead of the calendar YTD or Q1 result for the state group at 2.2%. The results for both periods this year were above what they were in 2014, which were 2.1% and 1.8% respectively.
Similar to QLD, improvements to dealer profitability in VIC/TAS can be attributed to strong front end performance. VIC/TAS dealers generated an average of $583 in selling gross per new vehicle sold in Q1 2015, which was $142 more than Q1 2014 and represents a 32% uplift. In used cars, the average VIC/TAs dealer generated $650 in selling gross per used vehicle retailed in Q1 2015 – an uplift of $194 or 43%.
Western Australia
Average dealer profitability in WA was 1.8% for the month of March, and 1.7% for Q1 in 2015. WA was the only state with a Q1 result lower this year when compared to 2014 where average NP%S was 2.4%.
Comparing to last year, the 2015 year so far has seen a contraction through all areas of the dealership for the average WA dealer – with this being reflected in the downward profitability movement. When comparing Q1 2015 to Q1 2014, total dealership selling gross and other income decreased by 35% and 32% respectively.
Segments
Dealer profitability for both March and Q1 in 2015 was higher for all segments when compared to 2014. The luxury segment continues to be the most profitable at 2.7% NP%S for Q1 2015, followed by the prestige and volume segment at 2.5%.
Click the chart below for more details.
Dealership data contained in this document has been obtained from the eProfitFocus database. Over 800 dealers across Australia have contributed towards this data.
© 2015 Deloitte Motor Industry Services Pty Ltd
General Information Only
This presentation contains general information only, and none of Deloitte Touche Tohmatsu Limited, its member firms, or their related entities (collectively the “Deloitte Network”) is, by means of this presentation , rendering professional advice or services.
Before making any decision or taking any action that may affect your finances or your business, you should consult a qualified professional adviser. No entity in the Deloitte Network shall be responsible for any loss whatsoever sustained by any person who relies on this presentation.
About Deloitte
Deloitte refers to one or more of Deloitte Touche Tohmatsu Limited (“DTTL”), its global network of member firms, and their related entities (collectively, the “Deloitte organization”). DTTL (also referred to as “Deloitte Global”) and each of its member firms and related entities are legally separate and independent entities, which cannot obligate or bind each other in respect of third parties. DTTL and each DTTL member firm and related entity is liable only for its own acts and omissions, and not those of each other. DTTL does not provide services to clients. Please see www.deloitte.com/about to learn more.
Deloitte Asia Pacific Limited is a company limited by guarantee and a member firm of DTTL. Members of Deloitte Asia Pacific Limited and their related entities, each of which are separate and independent legal entities, provide services from more than 100 cities across the region, including Auckland, Bangkok, Beijing, Hanoi, Hong Kong, Jakarta, Kuala Lumpur, Manila, Melbourne, Osaka, Seoul, Shanghai, Singapore, Sydney, Taipei and Tokyo.
This communication contains general information only, and none of Deloitte Touche Tohmatsu Limited (“DTTL”), its global network of member firms or their related entities (collectively, the “Deloitte organization”) is, by means of this communication, rendering professional advice or services. Before making any decision or taking any action that may affect your finances or your business, you should consult a qualified professional adviser.
No representations, warranties or undertakings (express or implied) are given as to the accuracy or completeness of the information in this communication, and none of DTTL, its member firms, related entities, employees or agents shall be liable or responsible for any loss or damage whatsoever arising directly or indirectly in connection with any person relying on this communication. DTTL and each of its member firms, and their related entities, are legally separate and independent entities.