


Navigating today’s change, shaping tomorrow’s future
Lee Peters | 14 April 2020
This article was featured in Automotive Dealer - March/April 2020 - Issue 30
“The oldest and strongest emotion of mankind is fear, and the oldest and strongest kind of fear is fear of the unknown” (H. P. Lovecraft)
… and this is where we are in the automotive industry, here in Australia, and all around the world. Change, and having to navigate the unknown, is not only inevitable… but it is now upon us.
This was the central theme during the recent Industry Overview roadshows across the country conducted by the Deloitte Motor Industry Services team during early March 2020. It was the largest ever turnout that the firm had encountered, with well over 1,000 people attending the sessions across the country.
This was very representative of where the industry is today, and representative of the thirst for information and insight to help the industry move forward with confidence. By unpacking the data from the Deloitte eProfitFocus benchmarking platform, we were able to identify where the opportunities for profit and growth can come from. And it was important to make the connection to the audience that the way to work through the changes and challenges going forward will best be done by everyone working together.
A data-led industry perspective…
When speaking about the concept of ‘change’, the obvious place to start is with the new vehicle volume level, and the fact that we are a quarter of the way through what is looking likely to be the third year in a row of negative change, with consecutive reductions in total volume since the market peaked at 1.189 million units back in 2017 – now 24 months in a row of volume decline.
Through capturing dealer data in eProfitFocus, we have seen this downturn translate into a real reduction of retail throughput, from an average of 95 units per month for the average dealer at the start of 2018, down to an average of 71 units per month towards the end of 2019.
There are many reasons for this downturn – the automotive industry is not alone in its challenges right now. Think about what the market is currently being faced with: the trauma of coronavirus, devastating environmental chaos (such as bushfires, drought, and flood), fluctuating house prices, evolving discretionary spending habits, slow wage growth, low consumer confidence, and the customer preferences that appear to be changing by the day… just to name a few.
It is important to look past what others see at a volume level and dig deeper into the data. Deloitte has access to this data from over 1,000 dealers across Australia and New Zealand, which is uploaded to the eProfitFocus platform every single month. What’s fascinating is that we’ve been capturing this data for over 20 years, and so have the opportunity and responsibility to tell the story of our automotive industry during this period.
The greatest measure of the automotive industry’s performance levels is the metric: net profit as a percentage of sales (NP%S). This is the bottom-line profit before income tax, divided by the total revenue, including all departments. For the calendar year 2019, the industry performed at 0.9% NP%S.
To put that in context, at the start of 2015, the industry was at 2.5% NP%S. In 2016, the squeeze on the industry started, down to 1.8% NP%S. Then again in 2017, down to 1.6% NP%S. And then 0.9% NP%S in both 2018 and 2019 (refer to fig. 1).
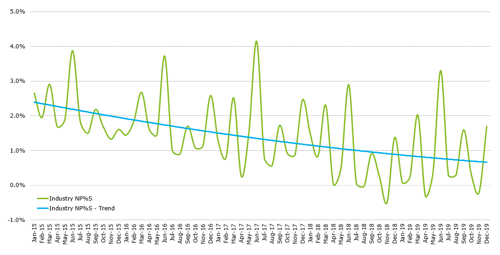
Fig. 1 - Average NP%S (all Dealers)
Further to this, 2019’s 0.9% was calculated on a much lower revenue base, due to the decline in new vehicle volume. Taking both the volume and the profit declines into consideration, the average dealership is now earning over 60% less profit than they were only four years ago.
Deloitte has analysed these performance metrics even further, looking at the data broken down by state, region, and size. Interestingly, this decline in performance appears systemic, as opposed to driven by pockets of the economy, or by specific underperforming states or regions. Most of the country’s dealership operations have all felt the recent squeeze. The Australian automotive industry has been through downturns before… but this one feels different. This one feels like ‘a new normal’, or potentially well down the road to what a ‘new normal’ may end up being.
To combat this downturn, most dealership operators have pushed hard to ‘right-size’ their business, and significantly reduce their cost structure. Just between 2018 and 2019 alone, the average reporting dealer was able to reduce their overhead expenses by over $50,000 per month (refer to fig. 2).
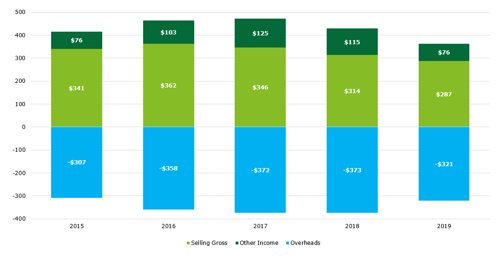
Fig. 2 - Adjustment in a Changing Market
During this period, we have seen that dealers’ response to this can be grouped into three very distinct ‘buckets’. In the first bucket, there are a number of dealers who have been able to reduce their operational cost base, but have not been able to improve the output from the remaining asset base, be that the remaining head count or capital assets – this has led to the shrinking of their operations. In the second bucket, there are a number of dealers who have also been able to reduce their operational cost base, and they have been able to get more from their people and assets – and these dealerships have been able to remain relatively successful during this difficult period. And then in the third bucket, there are a number of dealers who are yet to have been able to significantly reduce their cost base with any real purpose.
Speaking with Deloitte MIS’s Partner Grant Cameron about the focus on expense management going forward, he notes: “Now is the time for hard decisions to be made. We’re operating in different times, and therefore different levels of cost management decisions need to be made. And it’s not just about slashing costs. It’s actually more about doing things differently. Being bold, and trialling new solutions, and new ways of doing business.”
The bulk of the hard work, however, should be focused on optimising the operations in each of the departments. This is where the industry can get back to making profit, as the transformation of the industry is happening at a quick pace in the background.
New vehicle department
Today, the primary financial differentiator between the average dealer and the benchmark dealer is the new vehicle department. In fact, in 2019 the benchmark dealer achieved 13% more selling gross in their new vehicle department than the average dealer. And that was the biggest variance between the average and benchmark amongst all the departments.
In today’s industry, the new vehicle departments’ story starts and ends with the level of bonus income earned from the OEMs. Bonus and incentive income contributed 174% of an average dealer’s profit in 2019. So, in short, if an average dealer hit their targets, they would be profitable. But if they didn’t, they would lose money. The landscape is now as simple as that.
As you would expect, this drives multiple actions within a dealership operation… and not all of them are good actions. Potentially, it leads to salespeople focusing on the ‘hunt and kill’, rather than building effective relationships with customers. Potentially, it leads to poor hiring decisions, as dealers are ‘plugging holes’, rather than developing elite teams. Potentially, it means that dealers’ best people are monitoring target performance, rather than having your top talent focused on making money through the rest of the business. And potentially, and perhaps most importantly, it means that most dealers are focusing on a 30/60/90-day horizon, rather than lifting their attention to plan and implement strategies for a sustainable and profitable future.
Over the last two years alone, the OEM bonuses and incentives have increased from $840 per unit up to over $1,100 per unit. At the same time, transaction gross (i.e. ‘gross off the metal’) has severely declined, from well above $350 per unit, and now down to an average of a $25 loss per unit. So, on average, across more than 1 million vehicles sold, across more than 3,500 dealership rooftops, and across more than 50 brands… the average transaction gross per unit is now a negative $25 (refer to fig. 3).
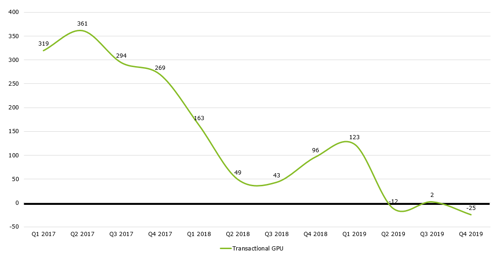
Fig. 3 - Transactional Gross per New Vehicle Unit
It’s not just the gross levels that are challenging in the new vehicle department, but the costs of doing business are also rising at the same time. There were multiple months over the last two years where the cost per unit has surpassed the gross per unit.
There have been dealers who have been able to slow down the trend, with the best dealers - which we consider our benchmark dealers in the top 30% of the database - having small, but important, positive gaps in their performance. In 2019, the benchmark dealers made $126 more transactional gross per unit than the average dealer and sold these for $146 less costs per unit. They made $55 extra in aftermarket income per unit and are selling their vehicles 3.3 days quicker than the average dealer.
Interestingly, the variation between an average performance and a benchmark performance in the new vehicle department was not down to volume. There was no difference in the units sold for each. Rather, the benchmark dealers were driving repeat customers through embedded CRM systems and stable sales teams. They were meticulous in their stock management and ensured that their stock orders were in line with local PMA demand levels. And they focused on advanced lead capture and management techniques, making sure that each precious lead was handled through to purchase or closure.
One area that stood out was the productivity measures for new vehicle departments. The eProfitFocus data shows that the metric of new vehicle units sold per salesperson per month has been declining over the last eight years. In an age where the customer experience is the best it has ever been, where the vehicle product is as good as it’s ever been, and with the integration of digitally enabled selling embedded throughout dealers’ businesses… the productivity of our salespeople has actually gone backwards (refer to fig. 4).
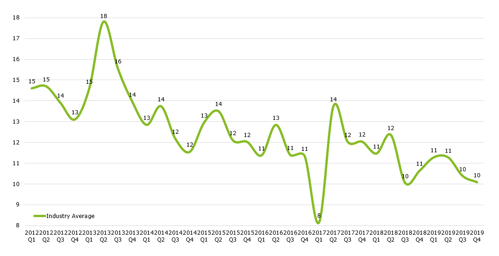
Fig. 4 - New Vehicle Units Sold per Salesperson per Month
Dale McCauley, another Deloitte MIS Partner, passionately speaks to this: “With the gross pool declining, and the cost of doing business increasing every day, dealers just have to do things differently. If we keep doing things the way we currently are, the trends will probably just continue. A re-design of the sales process, either complete or at least partial, should be happening in showrooms all around the country as we speak.”
Used vehicle department
Pleasingly, the data shows us that there are still opportunities in the used vehicle department. The average dealer makes over $2,000 per used vehicle sold, and the cost of doing business remains much lower than for the new vehicle department, so selling gross levels have remained attractive (refer to fig. 5).
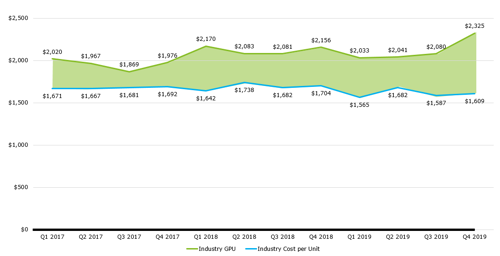
Fig. 5 – New Vehicle Units Sold per Salesperson per Month
The focus going forward for dealers now should be simply capturing their (un)fair share of the massive used vehicle market in Australia. Whilst approximately 2.5 million used cars are sold every year, the retail dealership network only sells approximately 0.5 million of them (with an average used to new ratio of 0.5 captured in the data).
Our Deloitte MIS Partner, Sam Venn, notes: “With many aspects of a dealer’s business - especially market and customer factors - becoming more and more uncontrollable, dealers should be shifting their focus to parts of their operations that they can take control of. Used cars are a perfect example of this as a ‘controllable opportunity.’”
In analysing the benchmark dealers for used vehicles, it becomes obvious that the primary differentiator is gross, rather than expense management. There was a $350+ better gross level amongst benchmark dealers in 2019, and only a minor variance in costs per unit sold.
To take that one step further for used cars, the differentiator was actually people. The best dealers paid their people more and incentivised their people more, but this directly led to more productivity and higher gross levels in total.
People in this department drove, and continue to drive, success. People, as well as a disciplined adherence to process. The benchmark dealers reduce their reconditioning time and minimise the number of days from purchase to a car being considered ‘sale ready’. They constantly analyse their sales and stock data, reviewing stock age and composition, cost of inventory and cost of sales, plus consumer preferences versus the available market. They source vehicles from multiple vendors, including private sellers, to reduce the reliance on auctions and tenders. And they collaborate between the valuers, the service department, and the new vehicle department, to ensure that all trade opportunities are captured. These are just some of the meticulous processes that the best operators are on top of… every single day.
Financing and insurance department
One of the primary driving factors of the profitability levels within the industry during the five-year period of 2013 - 2018 was the continued rise in prominence of the finance and insurance department within dealerships. This was seen as the ‘golden age’ of finance-driven profitability levels within the industry. As we all know, the last 12 months have been very different times.
Since the regulatory changes in the industry, and with the increased scrutiny the industry is now under, the level of finance and insurance income being made by dealerships has taken a significant step backwards. In the space of only two years, since the start of 2017, the level of finance and insurance income in the average dealership has declined by approximately 33%. This has translated into approximately $50,000 less being made by the average dealer through their finance and insurance department every month.
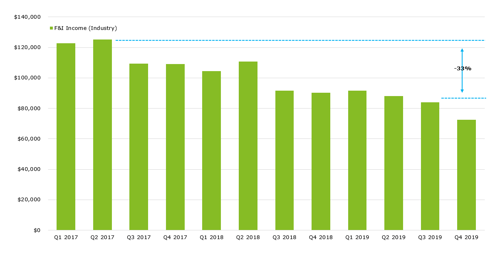
Fig. 6 - Average Finance and Insurance Income per Month
A lot of this decline in income is due to the lower levels of new vehicle volume, which has been discussed above. The other major factor is that despite the reduction of available rates and increase in consumer transparency, unfortunately finance penetration levels have not increased at all. The average new vehicle finance penetration rate amongst the industry is still wallowing at approximately 30%.
In discussing with Deloitte MIS’s Partner, Stephen Timperley, we start to understand the level of change required. Stephen, also a former Dealer Principal, notes: “If dealers are ever going to make seismic shifts in performance levels under the new legislative standards, doing what we’re doing now but just a little bit better will not be enough. Reversing this trend, and going past even where we used to be, will need us to think differently, be bold, and be prepared to try and fail at new ways of working.”
When comparing the levels of performance between an average dealer in finance and insurance versus a benchmark dealer, we start to understand that there are actually not many noticeable differences at all. Penetration levels, income per contract, and operational set-ups, don’t currently vary too much. Most dealers are embedding early introductions into the sales process, ensuring all products have point of sale collateral, and engaging their salespeople through internal promotions and financial incentives.
What that suggests is that there is a ‘pivot’ required by the whole industry. This pivot can still be dealer-led, but to step forward and step through these challenges, a collective and collaborative solution between dealers, OEMs, and financiers will be required to find a way of working that will need to be incorporated into the ‘front line’ business managers.
Service department
Aside from the used vehicle department, the other largely ‘controllable’ part of a dealer’s business is the service department, which unfortunately has also been under recent pressure.
At the start of 2017, only two years ago, the average service department across the industry was growing. And growing profitably. The increase in new vehicle volume to unprecedented levels was driving the internal service work in dealers’ workshops, and the total monthly labour sales of an average dealer broke through the $300,000 mark. During the height of the Takata warranty period, the average dealer’s workshop was very full and very busy, increasing to $320,000 of labour sales per month.
Towards the end of 2019 and into 2020, and after the new vehicle volume has declined and the bulk of the Takata warranty work has dried up, workshops have freed up again, and work bay utilisation has diminished. The average dealer is now only selling approximately $250,000 of total labour sales each month (refer to fig. 7).
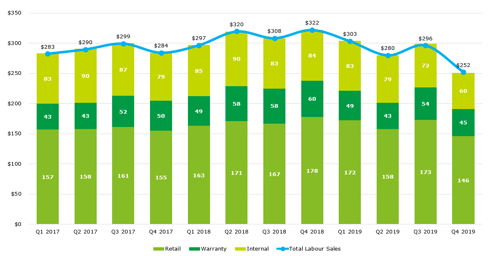
Fig. 7 - Average Service Labour Sales per Month
This is a significant decrease, especially given that the back-end of a dealer’s business now contributes over four times as much to the total profit pool as the front-end of the business does.
With a squeeze on total dealership gross upon us, the service department has to be a key area of a dealership that drags the rest of the business through these challenging times.
John Startari, a Deloitte MIS Partner and one of seven former OEM Managing Directors within the Deloitte MIS team, is particularly passionate about this need for focus: “No longer can dealers just accept that many of their valued customers end up going somewhere else for a service. Dealer technicians are better trained, dealers use genuine parts, dealers should be able to provide a better experience, dealers are able to offer excellent warranty packages through the brand, and most dealers have access to capped-price servicing programs meaning that they are very reasonably priced in the market. Add to that the fact that dealers get first crack at the customer, service retention and service growth really should be ‘home-runs’. But unfortunately, they’re not, meaning there’s a break-down somewhere. Those break-downs are some of the most important things to find.”
The good news is that the service work is out there in the market. And the profitable retail service work is also up for the taking. The benchmark dealers have been able to become ‘best-in-class’ at setting up CRM processes and customer call centres, to bring a proactive focus to pre-bookings and retention. They have been able to make it easy for customers - easy communication, easy bookings, easy drop-offs, easy calendarisation, easy technology interfaces, and easy relationship building platforms. This has been the key… in today’s society consumers want convenience and providing this should be a dealer’s primary aim.
Benchmark dealers have also implemented express servicing capabilities and focused on the concept of ‘facility utilisation’. They understand the capital expenditure that they have made, and therefore the importance of maximising their workshop facilities. The creative dealers are experimenting with extended trading hours, split shifts, inventive and flexible working hours, weekend internal servicing, and work-bay optimisation techniques. These have started to change the narrative of what a traditional service department should look and feel like and enables a more customer-focused and profit-focused alignment of strategy.
Smashing through the ceiling…
By analysing the Deloitte eProfitFocus data, and by working closely with dealerships right across the country, there are three things that have become abundantly clear in 2020.
Firstly, the industry can’t keep doing things the same way that we have always done. If we do, we will continue to get the same decline in performance as we have seen recently, being four years of profit decline, three years of volume decline, and a performance decline in most departments right across the business. Therefore, we need to think and act differently.
Secondly, profit is still very possible. We can see this by turning our attention to the benchmark dealers in the industry and hearing their stories. But whilst profit is possible, we need to re-balance dealers’ businesses back towards areas of greater profit opportunity.
And thirdly, the best dealers are still making money. Not just the best brands or the best regions… but the best operators. We are moving from a volume-driven era where rising sales ‘lifted all boats’ and are now living in the ‘age of the operator’, where better managed dealerships are likely to continue to open up a clear lead on the rest of the pack.
In addition to these three points, we also understand that optimising the traditional dealership business by reducing costs is not the opportunity that it once was. Most dealership businesses are running at expense levels within cost structures that we would have considered ‘bare bones’ merely a few years earlier.
What we do see is that dealers who perform well - at benchmark levels - in one department, are able to be profitable, and therefore should be cash-flow-positive. To reach ‘average’ levels of industry performance (0.9% NP%S), and eventually ‘benchmark’ levels, dealers need to operate at high levels in more than one department. These dealers look to manage performance across the broad range of their activities, rather than focusing on a single area of strength or opportunity.
Benchmark dealers in 2019 made 2.6% NP%S. While much lower than the benchmark level of 4% some dealers were earning a few years ago, 2.6% NP%S is just reward for the best dealers in the industry.
We clearly see that there is no ‘silver bullet’ to success in this industry. There never has been… not 20 years ago, not 10 years ago, and definitely not right now. What the best dealers do is be a little bit better at a lot of different things.
This balancing, or potential rebalancing, will also assist dealers prepare for the future.
Deloitte MIS’s Danny Rezek notes: “By being better balanced, a dealership will be able to be more agile to cope with the current and future challenges of automotive retail. Once dealership businesses are balanced, we should all be looking at smashing through the ‘benchmark ceilings’.”
Thriving in a new world…
So, throughout all this detailed review, all this operational observation, and all this financial analysis, the question then turns to - how do dealers thrive in this new world? This question is especially difficult given that we don’t really know what the ‘new world’ even is.
We need to start dreaming of an industry where the average dealer is selling 20 new vehicles per salesperson every month. We need to believe that an average used to new ratio of 1:1 is not only achievable, but the ‘new normal’. We need to re-imagine the finance and insurance department to enable 50% penetration rates to be a new baseline. We need to get to a place where accepting nothing less than 90% service retention after three years is acceptable. And we need to design an industry that is an employer of choice where 15% annual staff turnover rates are only due to natural attrition. What a world that would be…
Unfortunately, it’s often hard to see the woods from the trees. And amongst all the outside pressures and distractions, it is sometimes difficult to focus on what matters most… or to even know what we should be looking for.
If you think about what we have on our doorstep, there’s connected technology, autonomous driving, shared and subscription ownership models, electric power trains, online aggregators, and new OEM brands, just to name a few. And this is against the backdrop of a nation’s society that is going to be quite apprehensive for a long time, due to factors like the coronavirus, bushfires, and drought.
Most of the time, society over-estimates the amount of change in the short-term, but under-estimates the amount of change in the long-term. Hopefully, as an industry, we don’t stand there looking back at the time when we collectively under-estimated the amount of change that was upon us.
Obviously, no retail industry exists without its customers. Therefore, no projection of industry trends can exist in the absence of a perspective about the evolution of the customer base. And that’s probably the only place where we can start from… the customer. If we keep putting them at the centre of everything we do, then the place that we end up will be exactly where we should be.
Contacts:


General Information Only
This presentation contains general information only, and none of Deloitte Touche Tohmatsu Limited, its member firms, or their related entities (collectively the “Deloitte Network”) is, by means of this presentation , rendering professional advice or services.
Before making any decision or taking any action that may affect your finances or your business, you should consult a qualified professional adviser. No entity in the Deloitte Network shall be responsible for any loss whatsoever sustained by any person who relies on this presentation.
About Deloitte
Deloitte refers to one or more of Deloitte Touche Tohmatsu Limited (“DTTL”), its global network of member firms, and their related entities (collectively, the “Deloitte organization”). DTTL (also referred to as “Deloitte Global”) and each of its member firms and related entities are legally separate and independent entities, which cannot obligate or bind each other in respect of third parties. DTTL and each DTTL member firm and related entity is liable only for its own acts and omissions, and not those of each other. DTTL does not provide services to clients. Please see www.deloitte.com/about to learn more.
Deloitte Asia Pacific Limited is a company limited by guarantee and a member firm of DTTL. Members of Deloitte Asia Pacific Limited and their related entities, each of which are separate and independent legal entities, provide services from more than 100 cities across the region, including Auckland, Bangkok, Beijing, Hanoi, Hong Kong, Jakarta, Kuala Lumpur, Manila, Melbourne, Osaka, Seoul, Shanghai, Singapore, Sydney, Taipei and Tokyo.
This communication contains general information only, and none of Deloitte Touche Tohmatsu Limited (“DTTL”), its global network of member firms or their related entities (collectively, the “Deloitte organization”) is, by means of this communication, rendering professional advice or services. Before making any decision or taking any action that may affect your finances or your business, you should consult a qualified professional adviser.
No representations, warranties or undertakings (express or implied) are given as to the accuracy or completeness of the information in this communication, and none of DTTL, its member firms, related entities, employees or agents shall be liable or responsible for any loss or damage whatsoever arising directly or indirectly in connection with any person relying on this communication. DTTL and each of its member firms, and their related entities, are legally separate and independent entities.